
HAProxy and HAProxy Enterprise collect a vast amount of information about the health of your applications being load balanced. That data, which uses the Prometheus text-based format for metrics, is published to a web page hosted by the load balancer, and since many application performance monitoring (APM) tools can integrate with Prometheus, it’s likely that you can visualize the data using the APM software you already have.
In this blog post, you’ll learn about several metrics that stand out as particularly useful for monitoring the health of your applications when they’re load balanced by HAProxy.
How to Enable Prometheus Metrics
Prometheus is an open-source monitoring and alerting toolkit that collects and stores metrics. It scrapes data from HAProxy and stores it so that you can later query that data and visualize it. Your APM software will either query the Prometheus database directly or have Prometheus forward that data to a remote location, such as when you’re using a SaaS monitoring solution.
To get up and running, you’ll first need to run a Prometheus server to collect your HAProxy metrics. Follow the guide at DevopsCube for setting up a Prometheus server on Linux. Their guide describes how to configure Prometheus as a service so that it starts up after a reboot. You can do this on your HAProxy server if you like.
Once you have Prometheus running, check to see whether your version of HAProxy has had the Prometheus exporter compiled into it by calling the following command. If it hasn’t been, you can compile HAProxy yourself to get it.
| $ haproxy -vv | grep "Prometheus exporter" | |
| Built with the Prometheus exporter as a service |
Next, edit your HAProxy configuration file, /etc/haproxy/haproxy.cfg. Add a frontend section that includes a prometheus-exporter line. In the example below, I’ve also enabled the HAProxy Stats page at the same port, but the Prometheus metrics are published at the URL path /metrics. If you’re using HAProxy Enterprise, you’ll find configuration steps in the official documentation.
| frontend metrics | |
| bind :8404 | |
| stats enable | |
| stats uri / | |
| stats refresh 5s | |
| http-request use-service prometheus-exporter if { path /metrics } |
Restart the HAProxy service:
| $ sudo systemctl restart haproxy |
You can then open a browser and visit the /metrics page to see the data.
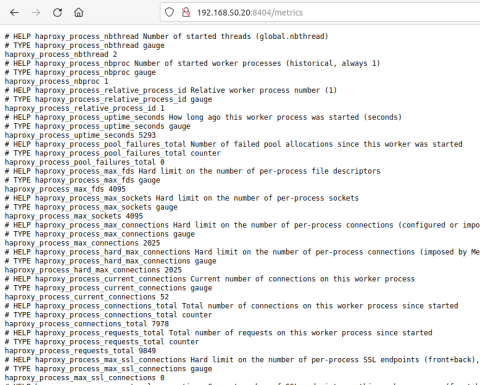
HAProxy Prometheus Metrics
As a last step, edit the file /etc/prometheus/prometheus.yml on the server where you’ve installed Prometheus and set the scrape interval and target. The target is your HAProxy server’s IP address and port.
| global: | |
| scrape_interval: 5s | |
| evaluation_interval: 5s | |
| scrape_configs: | |
| - job_name: 'haproxy' | |
| static_configs: | |
| - targets: ['127.0.0.1:8404'] |
Then restart the Prometheus service.
| $ sudo systemctl restart prometheus |
You can query the data by using the built-in Graph tab on your Prometheus server’s web page. Simply visit port 9090 on your Prometheus server. Because they implement the Prometheus format, you can write queries against the metrics using PromQL, the Prometheus query language. Do you use Grafana? If so, you can import Ricardo F.’s HAProxy Dashboard to get a dashboard with ready-made visualizations for your HAProxy data.
Now, let’s take a look at a few of the metrics that HAProxy publishes.
Up vs Down Servers
If you’ve enabled health checking of your servers, then in addition to HAProxy automatically removing failed servers from the load balancing rotation, it will also report in its metrics how many have failed. By keeping an eye on this indicator, you’ll quickly see how healthy your load balancing tier is overall.
Check the metric named haproxy_backend_agg_server_check_status. Notice that the filter, which is expressed between curly braces after the name of the metric, limits the results to only up servers in the backend named webservers.
| haproxy_backend_agg_server_check_status{proxy="webservers", state="UP"} |
You can plug this query into the Graph tab on the Prometheus web page, which is hosted at port 9090. Here, the number of servers that are up is three.
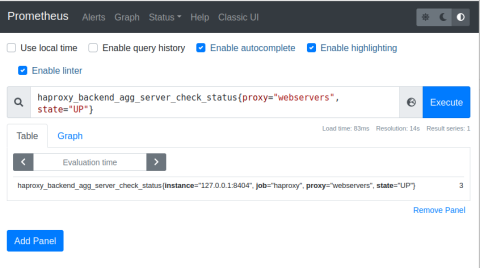
Prometheus Queries
You can execute the same query in Grafana when creating a new panel for your HAProxy dashboard. In this case, I’m executing two queries. One gets the number of servers that are up and the other gets the number that are down.
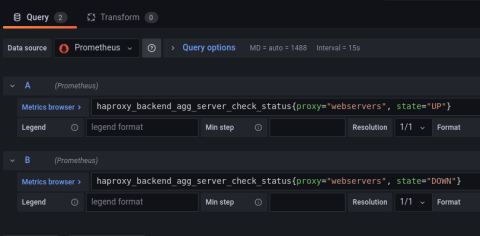
Queries in Grafana
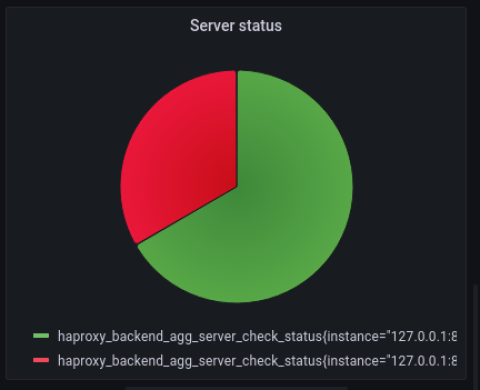
Grafana’s Pie chart visualization makes a nice representation that combines the two results. Here, I’ve disabled one of my three servers for effect, which displays a third of the pie chart in red.
Successful vs Failed HTTP Responses
Another metric to watch is successful vs failed server responses. When load balancing HTTP requests, you’ll want to know how many users are receiving valid, successful responses and how many are getting errors. This is especially true soon after you’ve deployed a new version of your application to know if the deployment introduced a major bug.
The haproxy_server_http_responses_total will give you this information. It returns the number of server responses that were either successful (an HTTP 2xx status), had a client error (an HTTP 4xx status), or had a server error (an HTTP 5xx error). Since it indicates a total number since the time you started HAProxy, you’ll want to use the rate function to get the rate of increase between the start and end of the observed period. Below, I am monitoring the rate of increase over a span of 30 seconds. Notice that I’m using a regular expression to convey that I want to monitor 2xx, 4xx, and 5xx responses.
| rate(haproxy_server_http_responses_total{proxy="webservers",code=~"2xx|4xx|5xx"}[30s]) |
Grafana’s Time series visualization works well for this type of data. You might also use Grafana’s Annotations API to mark on the visualization exactly when you deployed your app, so that you can see the before and after effects.
Queued HTTP Requests
With HAProxy, you can enable queueing so that HTTP requests queue up in the load balancer when a server reaches a maximum number of concurrent requests, which ultimately protects your servers from becoming overloaded. Learn how to do that in the blog post Protect Servers with HAProxy Connection Limits and Queues, but the gist is that you can add a maxconn parameter to a server line to set a limit. Under normal circumstances, the queue should stay small or empty. However, when the queue grows, it might indicate a problem with how quickly your servers are able to process requests or that they’re receiving an abnormally high volume of traffic.
Monitoring queue length and the average time users are spending in the queue will help you detect slowdown issues.
Check the metric named
haproxy_backend_current_queueto see how many users are in the backend’s queue.If you’re using server persistence, then users will queue up for a specific server instead of the backend in general. In that case, use
haproxy_server_current_queue.To see how much time users are spending in the queue, use
haproxy_backend_queue_time_average_seconds. Beware that this metric relies on there being at least 1,024 successful requests to average together.
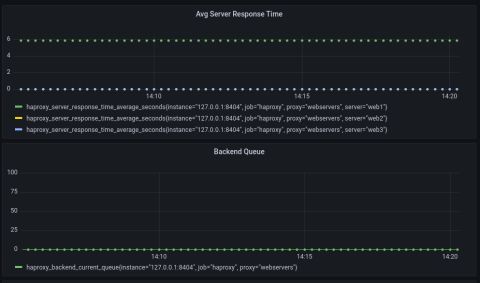
Server Response Times
Monitoring queue length will warn you of slow servers, but you’ll also want to know which servers are slow. For that, you can check the metric named haproxy_backend_response_time_average_seconds. It averages each server’s response time over the past 1,024 successful responses.
In the example below, two of the servers are taking almost no time at all to process requests, but another one is taking nearly six seconds! Luckily, the other servers are absorbing the overflow, and so the queue has stayed at zero.
Alerts
One additional perk of using Prometheus is that you can set up alerts that trigger when certain metrics cross a threshold. AlertManager integrates with tools like Opsgenie and PagerDuty to notify you of important events. Read the details for how to configure it in our blog post HAProxy Exposes a Prometheus Metrics Endpoint.
Conclusion
With HAProxy relaying traffic to your applications, it’s good to know that you can leverage its vast amount of metrics to detect problems early on. By exposing data using the Prometheus format, you can query the data using a range of APM tools. For example, you can use Ricardo F.’s HAProxy Dashboard package to visualize the data in Grafana. It’s also possible to define your own custom queries using the PromQL query language.
Want to keep up to date on similar topics? Subscribe to this blog. You can also follow us on Twitter and join the conversation on Slack. Interested in learning more about how HAProxy Enterprise offers advanced monitoring capabilities? Contact us today.
Subscribe to our blog. Get the latest release updates, tutorials, and deep-dives from HAProxy experts.