
The HAProxy Stats page provides a near real-time feed of data about the state of your proxied services.
In a previous blog post, Introduction to HAProxy Logging, you saw how to harness the power of HAProxy to improve observability into the state of your load balancer and services by way of logging. HAProxy also ships with a dashboard called the HAProxy Stats page that shows you an abundance of metrics that cover the health of your servers, current request rates, response times, and more. These metrics give you granular data on a per-frontend, backend, and server basis. You only need to add a stats enable directive, which is typically put into its own frontend section.
| frontend stats | |
| mode http | |
| bind *:8404 | |
| stats enable | |
| stats uri /stats | |
| stats refresh 10s | |
| stats admin if LOCALHOST |
The bind line sets which address and port you’ll use to access the dashboard. The optional stats uri line changes the URL’s path. The stats refresh line configures how often the dashboard will automatically refresh within your browser.
You can also put servers into maintenance mode or drain traffic from them using this screen. For that, you would add the stats admin line and restrict who can access these functions via an ACL statement. You can also set this to stats admin if TRUE to bypass the restriction. Optionally, add a stats auth <username:password> line to enforce Basic authentication.
With this in place, you can visit the /stats URL on port 8404 to see the dashboard:
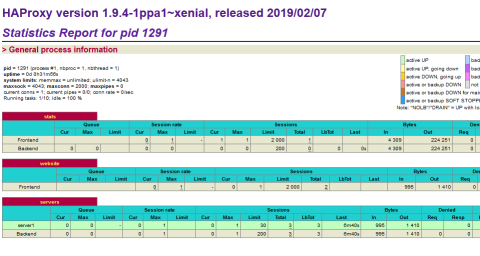
The HAProxy Stats Page
The HAProxy Stats page gives you a near real-time feed of information that you can use to troubleshoot proxied services, get insights about your traffic, and watch the load placed upon your servers. However, the metrics are labeled using shorthand names and prefixes. Before you can fully make use of them, you need to understand what they mean. In this blog post, you’ll tour the Stats page and learn what each section shows.
Frontend statistics
In this first section, we’ll explore the statistics related to frontends. A frontend is what a client connects to. As requests enter the load balancer—and as responses are returned to the client—they pass through the frontend. So, it has access to end-to-end timings, message sizes, and health indicators that encompass the whole request/response lifecycle.
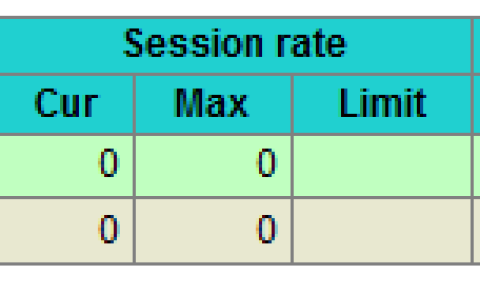
Session rate
The Session rate section, in the context of a frontend, describes the rate at which clients are connecting to HAProxy.
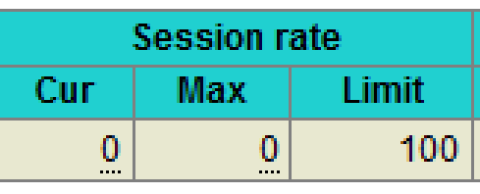
Frontend Session Rate
The Cur column shows the current rate at which client sessions, or fully established connections between client and server, are being created. If you hover your mouse over this field, the page displays the following drilldown metrics:
Metric | What it means |
Current connection rate per second | Rate at which clients are connecting to HAProxy (having not yet created full sessions) |
Current session rate per second | Rate at which sessions, which are entities that hold the state of an end-to-end connection (client to HAProxy and HAProxy to backend server), are being created |
Current request rate per second | Rate at which HTTP requests are being received over established connections |
The Max column shows the most sessions that have ever been in use simultaneously. If you hover your mouse over this field, the page displays the following drilldown metrics:
Metric | What it means |
Max connection rate per second | Highest rate at which clients have connected to HAProxy (having not yet created full sessions) |
Max session rate per second | Highest rate at which clients have established sessions, which are entities that hold the state of an end-to-end connection (client to HAProxy and HAProxy to backend server) |
Max request rate per second | Highest rate at which HTTP requests have been received over established connections |
The Limit column shows the maximum number of sessions per second that the frontend will accept, as set by the rate-limit sessions setting. If this limit is exceeded, additional connections are kept pending in the socket’s backlog (in system buffers).
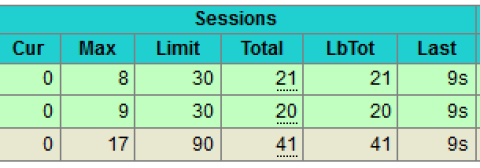
Sessions
In the context of a frontend, the Sessions section counts the number of sessions, or full client-to-server connections, in use on the load balancer.
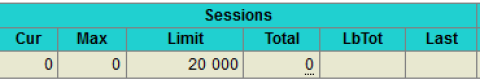
Frontend Sessions
The Cur column shows the current number of established sessions. The Max column shows the most sessions that have ever been simultaneously established.
The Limit column shows the most simultaneous sessions that are allowed, as defined by the maxconn setting in the frontend. That particular frontend will stop accepting new connections when this limit is reached. If maxconn is not set, then Limit is the same as the maxconn value in the global section of your configuration. If that isn’t set, the value is based on your system.
When you hover over the Total column, the page displays the following drilldown metrics:
Metric | What it means |
Cum. connections | Cumulative number of connections established since HAProxy was last reloaded. |
Cum. sessions | Cumulative number of sessions (end-to-end connections) established since the last reload. |
Cum. HTTP requests | Cumulative number of HTTP requests since the last reload. |
HTTP 1xx responses | Total number of HTTP requests that received a 1xx response. |
HTTP 2xx responses | Total number of HTTP requests that received a 2xx response. |
Compressed 2xx | Total number of 2xx responses that were compressed, if compression has been enabled. It also shows the percentage of requests that were compressed. |
HTTP 3xx responses | Total number of HTTP requests that received a 3xx response. |
HTTP 4xx responses | Total number of HTTP requests that received a 4xx response. |
HTTP 5xx responses | Total number of HTTP requests that received a 5xx response. |
Other responses | Total number of HTTP requests that received a response not covered by the other metrics. |
Intercepted requests | Total number of requests intercepted and redirected to the HAProxy Stats page. |
Cache lookups | Total number of times the cache was checked for a resource. |
Cache hits | Total number of times a cached resource was returned. |
Failed hdr rewrites | Total number of times that an HTTP header could not be added or set because there was not enough space left in the buffer. Try increasing |
The LbTot and Last columns are not used in this section.
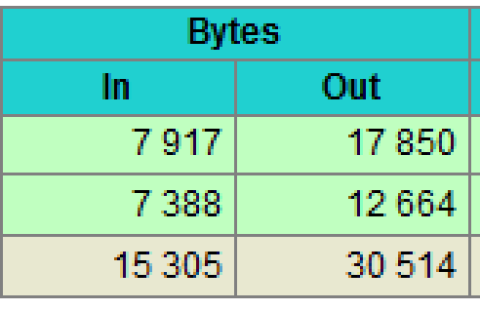
Bytes
In the context of a frontend, the Bytes section displays the cumulative amount of data sent and received between HAProxy and downstream clients.
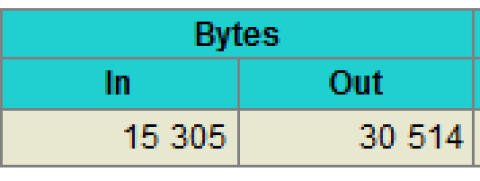
Frontend Bytes
The In column shows the total number of bytes received and the Out column shows the total number of bytes sent.
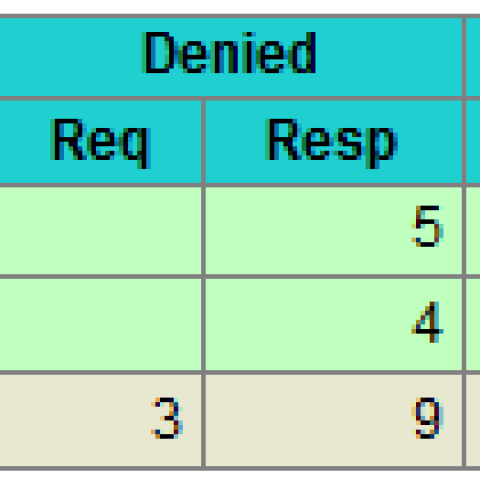
Denied
The Denied section shows the number of requests and responses that were rejected because of security concerns.
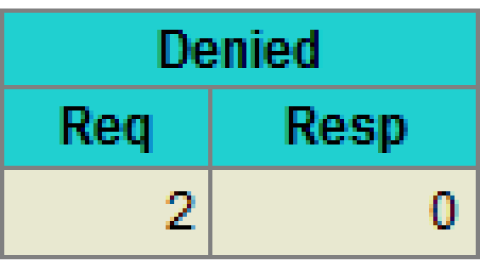
Frontend Denied
The Req column shows the number of requests that were denied due to any of the following configuration directives placed in the frontend or listen section:
http-request denyhttp-request rejecthttp-request silent-drophttp-request tarpithttp-response silent-droptcp-request connection silent-droptcp-request content rejecttcp-request content silent-drop
The Resp column shows the number of responses that were denied by an http-response deny directive that was placed in the frontend or listen.
Errors
In the context of a frontend, only the Req column is used in the Errors section. It shows the number of requests that encountered an error.
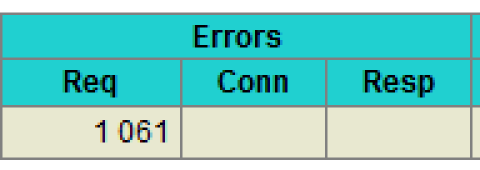
Frontend Errors
Possible causes include:
early termination from the client
a read error from the client
the client timed out
the client closed the connection
the client sent a malformed request
the request was tar pitted
Server
The only field from the Server section that applies to a frontend is the Status field.
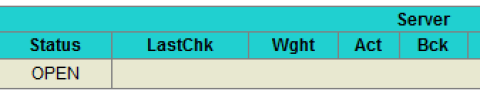
Frontend Status
When Status is OPEN, the frontend is operating normally and ready to receive traffic. You can disable the frontend, which will change its status to STOP, by executing the disable frontend Runtime API command. Here’s an example of calling that command:
| $ echo "disable frontend website" | sudo socat stdio /run/haproxy.sock |
Use the enable frontend command, which has the same syntax, to change the frontend’s status back to OPEN.
Backend statistics
A backend is a pool of load-balanced servers. HAProxy sends requests to a backend and then receives a response from one of the active servers. Statistics here include information about the health of each server, timings related to queuing, connecting, and getting a response, and request rates.
Queue
The Queue section applies only to backends and shows how long clients are waiting for a server to become available. HAProxy is able to queue connections when you use the maxconn setting. This reduces strain on your backend servers.
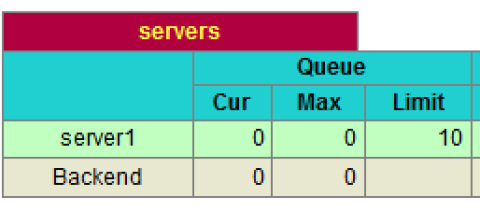
Backend Queue
The Cur column shows the number of client connections that are currently queued and not yet assigned to a server. The Max column shows the most connections that have ever been queued at once. The Limit column shows the maximum number of connections that are allowed to be queued, as defined by the maxqueue setting on each server line. Setting a maximum limit on how many connections can be queued is one way to ensure that clients don’t stay queued for too long. You can also set timeout queue to set a time limit for how long a client can stay queued before HAProxy returns an error response.
Session rate
In the context of a backend server, a session means the same as a connection. These statistics show the rate at which connections are being made to a server.
Backend Session Rate
The Cur column shows the current rate, per second, at which connections are being established to the server. The Max column shows the highest rate at which connections have ever been established to the given server. The Limit column is not used.
Sessions
In the context of a backend, the Sessions section shows the number of current connections to any of the active servers.
Backend Sessions
The Cur column lists the number of active connections to a server. The Max column shows the most connections that have ever been simultaneously established to the given server. The Limit column shows the maximum number of connections allowed for a server, as set by the maxconn parameter on a server line.
The backend row shows the value of fullconn for Limit or, if not set, it uses the following formula: Sum of the Sessions Limit values for frontends that route to this backend, divided by 10. So, if you have two frontends that each have a limit of 1000, their sum would be 2000. Divide that by 10 to get the value 200 for the limit for this backend.
The Total column shows the cumulative number of connections that have used the given server. When you hover over this field, a dropdown displays the following drilldown metrics:
Metric | What it means |
Cum. sessions | Cumulative number of connections established to this server. |
New connections | Number of times a new connection was established instead of reusing an existing one. |
Reused connections | Number of times an existing connection was reused. |
Cum. HTTP responses | Cumulative number of HTTP responses received from this server. |
HTTP 1xx responses | Total number of HTTP 1xx responses from this server. |
HTTP 2xx responses | Total number of HTTP 2xx responses from this server. |
HTTP 3xx responses | Total number of HTTP 3xx responses from this server. |
HTTP 4xx responses | Total number of HTTP 4xx responses from this server. |
HTTP 5xx responses | Total number of HTTP 5xx responses from this server. |
Other responses | Total number of HTTP responses not covered by the other metrics. |
Failed hdr rewrites | Total number of times that an HTTP header could not be added or set because there was not enough space left in the buffer. Try increasing |
Queue time | The amount of time in milliseconds that a connection stayed queued while waiting for a connection slot to the server, averaged over the last 1024 successful connections. |
Connect time | The amount of time in milliseconds it took to successfully connect to the server, averaged over the last 1024 successful connections. |
Response time | The server response time in milliseconds averaged over the last 1024 successful connections. |
Total time | The total session time in milliseconds averaged over the last 1024 successful connections. |
The LbTot column shows the total number of times the given server was selected to serve a request. This can be due to normal load balancing or because of a redispatch from a failed server. The Last column shows the time since the last connection was received. At the bottom of this section, in grey, the metrics are summed and reported for the backend overall.
Bytes
In the context of a backend, the Bytes section displays the amount of data sent and received between HAProxy and the upstream server.
Backend Bytes
The In column shows the number of bytes sent to the server. The Out column shows the number bytes received back. The bottom row shows a total for the backend as a whole across all servers.
Denied
The Denied section shows the number of requests and responses that were rejected because of security concerns.
Backend Denied
The Req column only applies to the backend as a whole. It shows the number of requests that were rejected by any of the following configuration directives in a backend:
http-request denyhttp-request rejecthttp-request silent-drophttp-request tarpithttp-response silent-droptcp-request content rejecttcp-request content silent-droptcp-response content silent-drop
The Resp column shows the number of responses that were rejected for any given server due to any of the following configuration directives in a backend:
http-response denytcp-response content reject
The bottom row shows the sum of these individual server metrics.
Errors
Errors show the number of errors related to communicating with a backend server.
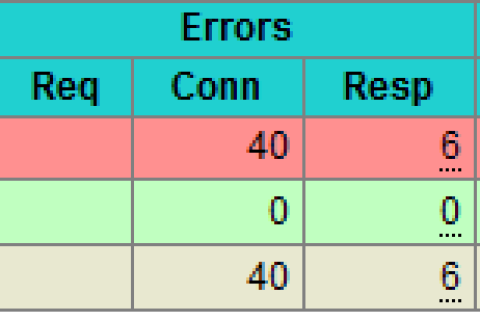
Backend Errors
The Req column is not used. The Conn column shows the number of requests that encountered an error while trying to connect to the server. For example, if you shut down a server while HAProxy had already begun to connect, then you would see this number rise. Health checks will remove the server from the rotation eventually.
The Resp column shows errors encountered while getting the response. For example, closing the connection with tcp-response content close will increase this count.
Warnings
The Warnings section in a backend displays the number of retries and redispatches.
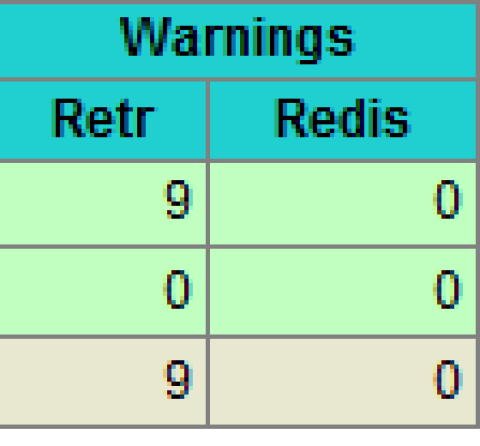
Backend Warnings
If you’ve added a retries directive to your backend, then the Retr column shows the total number of times that a connection was retried. The Redis column shows the number of times that HAProxy failed to establish a connection to a server and redispatched it to another server. This requires that you’ve added an option redispatch directive.
Server
In the context of a backend, the Server section shows various details about the status, health and weight of each server.
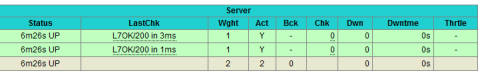
Backend Server Status
The Status column displays whether the server is currently up and for how long. It can display any of the following statuses:
Status | What it means |
UP | The server is reporting as healthy. |
DOWN | The server is reporting as unhealthy and unable to receive requests. |
NOLB | You’ve added |
MAINT | The server has been disabled or put into maintenance mode. |
DRAIN | The server has been put into drain mode. |
no check | Health checks are not enabled for this server. |
The LastChk columns show a value like L7OK/200 in 1ms. That particular value means that a Layer 7 health check was performed; it returned an HTTP 200 OK response and it did so within 1 millisecond. Or, if you see L4OK in 0ms, that means that HAProxy was able to make a Layer 4 connection to the server.
The Wght column shows the proportion of traffic it will accept, as set by the weight parameter on the server line. The Act column shows whether the server is active (marked with a Y) or a backup (marked with a -). Closely related, the Bck column shows whether the server is a backup (marked with a Y) or active (marked with a -).
The Chk column shows the number of failed health checks. The Dwn column shows the number of transitions from UP to DOWN. The Dwntme column shows how long the server has been down.
If you’ve added a slowstart parameter to a server line, then when you disable and later enable that server, the Thrtle column shows the percentage of traffic the server will accept. The percentage will gradually rise to 100% over the period you’ve set.
Yes, HAProxy offers a GUI for monitoring.
It comes with a built-in, real-time dashboard called the HAProxy Stats page, which provides a detailed feed of metrics about your frontends, backends, and servers. For more advanced needs, HAProxy Fusion provides enterprise-grade observability with customizable dashboards and historical data.
Conclusion
In this blog post, you were taken on a tour of the HAProxy Stats page. You learned what each field means in the context of a frontend or backend section. A great deal of information is contained on this dashboard and now you’ll know how to make full use of it!
HAProxy Fusion provides full-lifecycle management, monitoring, and automation of multi-cluster, multi-cloud, and multi-team HAProxy Enterprise load balancer deployments. HAProxy Fusion combines a high-performance control plane with a modern GUI and API (with 100% coverage), enterprise administration, and a comprehensive observability suite including customizable dashboards, traffic map views, and a granular Request Explorer.
Both products are core components of HAProxy One: the world's fastest application delivery and security platform that is the G2 category leader in API management, container networking, DDoS protection, web application firewall (WAF), and load balancing.