This blog post describes how to implement autoscaling of your application pods using KEDA and the HAProxy Kubernetes Ingress Controller. Since it was published, a new feature has been added to the ingress controller that lets you autoscale the number of ingress controller pods too! Read about it here.
One of the greatest strengths of containers is the ability to spin more of them up quickly. As the volume of traffic to your application increases, you can create more application containers on the fly to handle it, in almost no time at all. Kubernetes ships with autoscaling baked in, giving you the power to scale out when the system detects an increase in traffic—automatically!
The only shortcoming is that the built-in autoscaler, which is called the Horizontal Pod Autoscaler, can only monitor a pod’s CPU usage. In this blog post, you will learn how to use the open-source tool KEDA (Kubernetes Event-Driven Autoscaler) to monitor metrics coming out of the HAProxy Kubernetes Ingress Controller instead.
The HAProxy Kubernetes Ingress Controller exposes more than 100 different Prometheus-style metrics, which KEDA can watch and use to trigger autoscaling. For this blog post, I decided that KEDA should watch my application’s queue length, which is the number of HTTP requests queued up in the ingress controller, not yet forwarded to the backend application. Queueing protects your application pods from becoming saturated with requests. Instead, the ingress controller buffers them and doles them out at a steady volume, which optimizes your application’s performance by shielding it from having to do too much work at once.
When queue length grows long, however, it indicates that the application can’t keep up with demand. That makes it the ideal metric for KEDA to monitor and trigger autoscaling. Read on to learn how to set it up.
Deploy a Prometheus server
The Prometheus server collects metrics from pods and stores them in its time-series database. The HAProxy Kubernetes Ingress Controller publishes Prometheus-style metrics by default, so storing them is just a matter of configuring the ingress controller pods to be scraped by the Prometheus server.
First, deploy the Prometheus server into your Kubernetes cluster using the following Helm commands:
| $ helm repo add prometheus-community \ | |
| https://prometheus-community.github.io/helm-charts | |
| $ helm repo update | |
| $ helm install prometheus prometheus-community/prometheus |
Next, use kubectl to expose the Prometheus server on localhost port 9090 so that you can view its dashboard at http://localhost:9090.
| $ kubectl port-forward service/prometheus-server 9090:80 |
This is a quick and easy way to access the Prometheus dashboard, but in a production environment, you could define an Ingress route to do this instead. Open the dashboard in your browser and you’ll be greeted by the Expression browser, which lets you query Prometheus for time-series data that it has stored and visualized it as a graph.
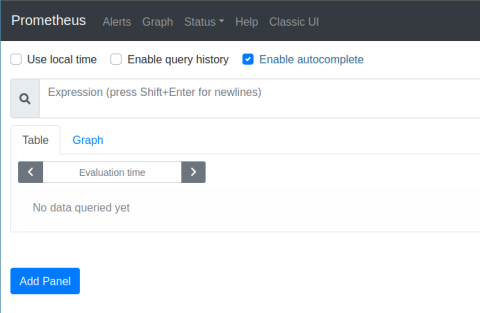
For now, we don’t have any data to show. You’ll come back here once you’ve configured the Prometheus server to collect metrics from HAProxy.
Likely, you’ll want to use a PersistentVolume for storage to ensure that the data remains durable, even if the node on which the Prometheus server container is running fails. The Prometheus Helm chart supports enabling this with a flag. We won’t cover that in this blog post though.
Deploy the HAProxy Kubernetes Ingress Controller
Next, deploy the HAProxy Kubernetes Ingress Controller using Helm. The nice thing about the Prometheus server is that it is programmed to collect metrics from any pod in the cluster as long as that pod sets the prometheus.io/scrape attribute to true. So, let’s add that attribute to the ingress controller before installing it.
Create a file named values.yaml and add the following contents to it:
| controller: | |
| podAnnotations: | |
| prometheus.io/scrape: true | |
| prometheus.io/path: /metrics | |
| prometheus.io/port: 1024 |
Since the ingress controller publishes Prometheus metrics by default at port 1024 on the URL path /metrics, you only need to set the prometheus.io attributes to match. Then, deploy the ingress controller as shown below, specifying the path to the values.yaml file when you call helm install:
| $ helm repo add haproxytech https://haproxytech.github.io/helm-charts | |
| $ helm repo update | |
| $ helm install kubernetes-ingress haproxytech/kubernetes-ingress -f values.yaml |
Deploy a sample application
Once the ingress controller is up and running, deploy a sample application on which to test autoscaling; we will route traffic for the app through the ingress controller. The following YAML markup, which you can save as app.yaml, deploys the sample application:
| apiVersion: apps/v1 | |
| kind: Deployment | |
| metadata: | |
| labels: | |
| run: app | |
| name: app | |
| spec: | |
| replicas: 1 | |
| selector: | |
| matchLabels: | |
| run: app | |
| template: | |
| metadata: | |
| labels: | |
| run: app | |
| spec: | |
| containers: | |
| - name: app | |
| image: quay.io/nickmramirez/webapp | |
| ports: | |
| - containerPort: 80 | |
| --- | |
| apiVersion: v1 | |
| kind: Service | |
| metadata: | |
| labels: | |
| run: app | |
| name: app | |
| annotations: | |
| haproxy.org/pod-maxconn: "30" | |
| spec: | |
| selector: | |
| run: app | |
| ports: | |
| - name: http-port | |
| port: 80 | |
| protocol: TCP | |
| targetPort: 80 | |
| --- | |
| apiVersion: networking.k8s.io/v1 | |
| kind: Ingress | |
| metadata: | |
| name: app-ingress | |
| namespace: default | |
| annotations: | |
| haproxy.org/path-rewrite: /app/(.*) /\1 # strip off /app from URL path | |
| spec: | |
| rules: | |
| - http: | |
| paths: | |
| - path: /app | |
| pathType: Prefix | |
| backend: | |
| service: | |
| name: app | |
| port: | |
| number: 80 |
Not much here will be particularly interesting to you if you’ve used Deployment, Service, and Ingress definitions before. However, there are a few things to note:
The Deployment definition launches one instance of the application, which uses the Docker image quay.io/nickmramirez/webapp. This is a home-grown app, which you’ll find on GitHub. If you pass it a URL path of /delay/5, it will wait five seconds before returning a response. That’s perfect for this tutorial because I want to demonstrate a slow app that can’t accommodate a heavy load of traffic on its own.
The Service definition includes an attribute named haproxy.org/pod-maxconn, which is set to 30. When the ingress controller sees this attribute on the service, it sets a hard limit on the number of concurrent HTTP requests that it will send to the application. Excess requests are queued up. We are going to configure autoscaling based on this queue so that when the queue length rises above a threshold, more application pods are created. But remember, without a maxconn, there is no queue!
The Ingress definition registers the application with the ingress controller.
Deploy the sample application using the following kubectl command:
| $ kubectl apply -f app.yaml |
Deploy KEDA
KEDA is the Kubernetes Event-Driven Autoscaler. There is an autoscaler built into Kubernetes—which is called the Horizontal Pod Autoscaler—that does a wonderful job of scaling pods based on how much CPU the pod is using. KEDA, however, can trigger autoscaling based on many other types of metrics, including Prometheus metrics. So, we can use it to watch the queue length in HAProxy, which we store in the Prometheus server, and scale the application pods automatically when the queue’s length becomes too long.
Deploy KEDA using Helm:
| $ helm repo add kedacore https://kedacore.github.io/charts | |
| $ helm repo update | |
| $ kubectl create namespace keda | |
| $ helm install keda kedacore/keda --namespace keda |
KEDA uses a custom resource definition called a ScaledObject to set the parameters for when it should scale out a pod. Create a file named scaledobject.yaml and add the following to it:
| apiVersion: keda.sh/v1alpha1 | |
| kind: ScaledObject | |
| metadata: | |
| name: app-scaledobject | |
| spec: | |
| scaleTargetRef: | |
| kind: Deployment | |
| name: app | |
| pollingInterval: 20 | |
| minReplicaCount: 1 | |
| maxReplicaCount: 10 | |
| advanced: | |
| restoreToOriginalReplicaCount: false | |
| horizontalPodAutoscalerConfig: | |
| behavior: | |
| scaleDown: | |
| stabilizationWindowSeconds: 300 | |
| policies: | |
| - type: Percent | |
| value: 25 | |
| periodSeconds: 60 | |
| triggers: | |
| - type: prometheus | |
| metadata: | |
| serverAddress: http://prometheus-server.default.svc.cluster.local | |
| metricName: haproxy_backend_current_queue | |
| query: sum(avg_over_time(haproxy_backend_current_queue{proxy="default-app-http-port"}[1m])) | |
| threshold: '10' |
Deploy it with the following command:
| $ kubectl apply -f scaledobject.yaml |
Let’s dig into the ScaledObject definition. The first part of the spec section defines which pod we want to autoscale:
| spec: | |
| scaleTargetRef: | |
| kind: Deployment | |
| name: app | |
| pollingInterval: 20 | |
| minReplicaCount: 1 | |
| maxReplicaCount: 10 |
In this case, the Deployment named app is chosen. The pollingInterval fieldsets how often KEDA should check the state of the pods to see whether it needs to scale up or down. Here, it has an interval of 20 seconds. The minReplicaCount sets the minimum number of pods that must run, while the maxReplicaCount sets the maximum. KEDA will never scale beyond this range.
After that comes the advanced section:
| advanced: | |
| restoreToOriginalReplicaCount: false | |
| horizontalPodAutoscalerConfig: | |
| behavior: | |
| scaleDown: | |
| stabilizationWindowSeconds: 300 | |
| policies: | |
| - type: Percent | |
| value: 25 | |
| periodSeconds: 60 |
The restoreToOriginalReplicaCount determines whether KEDA should reset the number of pods to the starting point when you delete this ScaledObject from your cluster. If you set it to false, it will keep the scaled-up number.
The horizontalPodAutoscalerConfig section lets KEDA plug into the built-in Horizontal Pod Autoscaler functionality. We’re using HPA’s scaling behavior feature, which controls how quickly KEDA should scale back down once the traffic load becomes less demanding. This is actually very important; it prevents your pods from being scaled up and down erratically, which is known as thrashing.
Consider this: When KEDA sees that queue length in HAProxy is too high, it creates new pods to help with the load. Predictably, this helps to reduce the load. So, the next time KEDA checks, the load is low again. Shouldn’t it scale the pods back down? Of course, traffic may still be intense and it is only mitigated because we have more pods running! But how is KEDA to know that? The stabilizationWindowSeconds field tells KEDA to wait 300 seconds (5 minutes) before scaling back down, which helps prevent thrashing. The policies section tells it to remove at most 25% of the pods every 60 seconds. So, you’ll get a gradual step down of the pods, and only if the load at each stage remains low.
The last section defines the autoscaling triggers:
| triggers: | |
| - type: prometheus | |
| metadata: | |
| serverAddress: http://prometheus-server.default.svc.cluster.local | |
| metricName: haproxy_backend_current_queue | |
| query: sum(avg_over_time(haproxy_backend_current_queue{proxy="default-app-http-port"}[1m])) | |
| threshold: '10' |
We’re using the prometheus trigger. We specify the location of our Prometheus server by setting the serverAddress field to the DNS hostname prometheus-server.default.svc.cluster.local. Kubernetes gives services DNS names like this automatically.
We set the query field to a Prometheus expression. This is the metric that KEDA watches to know when to scale out. The query expression here gets the average queue lengths over the last minute from all ingress controller pods; it then sums them. This gives you a cluster-wide average for the HAProxy queue length. By default, the Helm chart deploys two pods running the ingress controller, which share traffic, so we need to sum their numbers.
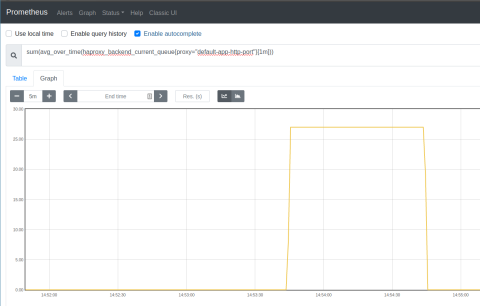
You can plug this same expression into the Prometheus server’s Express browser to see the queue length value graphed over time.
Simulate load
Let’s try it out. In situations like this, I like to use k6, which is an open-source load-testing tool. The reason I like it is that I can define different stages with different volumes of load. First, I create a file named test.js and add the following to it:
| import http from 'k6/http'; | |
| import { sleep } from 'k6'; | |
| export let options = { | |
| stages: [ | |
| { duration: '30s', target: 100 }, // ramp-up of traffic from 1 to 100 users over 30 seconds. | |
| { duration: '2m', target: 100 }, // stay at 100 users for 2 minutes | |
| { duration: '10s', target: 200 }, // ram up to 200 users | |
| { duration: '5m', target: 200 }, // stay at 200 users for 5 minutes | |
| ] | |
| }; | |
| // call the /delay/5 URL path to simulate a slow application | |
| export default () => { | |
| http.get('http://192.168.99.105:30034/app/delay/5'); | |
| sleep(1); | |
| }; |
This script ramps up to 100 concurrent users and lasts two minutes. Then it raises up to 200 users for five minutes. Execute the script using the k6 run command:
| $ k6 run test.js | |
| /\ |‾‾| /‾‾/ /‾‾/ | |
| /\ / \ | |/ / / / | |
| / \/ \ | ( / ‾‾\ | |
| / \ | |\ \ | (‾) | | |
| / __________ \ |__| \__\ \_____/ .io | |
| execution: local | |
| script: test.js | |
| output: - | |
| scenarios: (100.00%) 1 scenario, 200 max VUs, 8m10s max duration (incl. graceful stop): | |
| * default: Up to 200 looping VUs for 7m40s over 4 stages (gracefulRampDown: 30s, gracefulStop: 30s) | |
| running (0m49.8s), 100/200 VUs, 432 complete and 0 interrupted iterations | |
| default [===>----------------------------------] 100/200 VUs 0m49.8s/7m40.0s |
Watch the queue length in the Prometheus Express browser; you should see that the queue grows sharply as the load increases. It decreases sharply as KEDA deploys more application pods, as shown in the screenshot below.
Also, watch your Kubernetes cluster to see that your pods scale with the changing demand. You can call kubectl get pods with the watch flag (-w) to continuously monitor the number of application pods. In the following example, KEDA scaled up the pods while k6 ran the load test. I’ve added comments to annotate what was happening at each stage:
| $ kubectl get pods -l "run=app" -w | |
| NAME STATUS AGE | |
| # starting off with just 1 pod | |
| app-659c4db59d-qwsgz Running 42h | |
| # When load was 100 concurrent users, | |
| # another pod was created | |
| app-659c4db59d-xtsg7 Pending 0s | |
| app-659c4db59d-xtsg7 ContainerCreating 0s | |
| app-659c4db59d-xtsg7 Running 3s | |
| # When load was 200 concurrent users, | |
| # two more pods were created | |
| app-659c4db59d-9hlgf Pending 0s | |
| app-659c4db59d-zdjjz Pending 0s | |
| app-659c4db59d-9hlgf ContainerCreating 0s | |
| app-659c4db59d-zdjjz ContainerCreating 0s | |
| app-659c4db59d-zdjjz Running 2s | |
| app-659c4db59d-9hlgf Running 3s | |
| # After 5 minutes, KEDA began scaling back down, | |
| # 1 pod each minute | |
| app-659c4db59d-9hlgf Terminating 5m49s | |
| app-659c4db59d-zdjjz Terminating 6m51s | |
| app-659c4db59d-xtsg7 Terminating 9m52s |
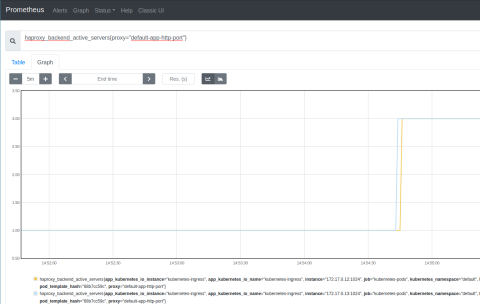
As you can see, autoscaling created pods when the load was high but gradually scaled back down after about five minutes. You can see the same information in the Prometheus Expression Browser with this query:
| haproxy_backend_active_servers{proxy="default-app-http-port"} |
You can adjust the ScaledObject definition to have a longer stabilization window, change the threshold for queue length, or watch a different Prometheus metric. KEDA gives you plenty of options, but monitoring HAProxy via its published metrics is at the heart of it all.
Conclusion
KEDA is the Kubernetes Event-Driven Autoscaller. It supports various triggers, including monitoring a Prometheus server for changes to a particular metric. In combination with the HAProxy Kubernetes Ingress Controller, through which all traffic flows into your cluster, you can configure intelligent autoscaling based not just on the CPU utilization of a pod but on how well your pods are handling a load. When a pod becomes too busy to respond to incoming connections quickly, the queue length grows in HAProxy, and KEDA uses that to trigger the creation of new pods.
Hopefully, this helps you build more efficient systems with Kubernetes!
Subscribe to our blog. Get the latest release updates, tutorials, and deep-dives from HAProxy experts.