How do you handle 23 million requests per second while maintaining peak performance and minimizing downtime? For most organizations, this traffic scale would be impossible to manage efficiently. Yet Criteo, the world's largest independent AdTech company, has built a sophisticated load balancing infrastructure that processes 9 billion bid requests daily across six data centers and three continents using HAProxy as its foundation.
In this comprehensive session from HAProxy Conference, Basha from Criteo's Site Reliability Engineering team reveals the automation strategies and performance optimizations that transformed their load balancing stack. Operating 2% of their 30,000 servers as dedicated load balancers, Criteo has evolved from vendor-locked appliances to a fully automated HAProxy-based Load Balancer as a Service (LBaaS) platform. The presentation covers two critical areas: advanced automation techniques that drastically reduce HAProxy reloads through TLS certificate management and dynamic server provisioning, and CPU optimization strategies including TLS session resumption and intelligent thread grouping.
You'll discover how Criteo automated the lifecycle of over 5,000 certificates with zero reloads during renewal, implemented dynamic server APIs to handle auto-scaling applications that grow from 115 to 600 instances in hours, and achieved a 20% reduction in context switching through strategic CPU allocation policies. Whether you're managing high-traffic applications or seeking to optimize HAProxy performance, this session provides actionable insights from one of the world's most demanding production environments.
Slide Deck
Here you can view the slides used in this presentation if you’d like a quick overview of what was shown during the talk.


Hi, everybody, thank you for being here. My name is Basha, and I work for a company named Criteo, which is in the AdTech industry. I'm an SRE on the network load balancer team, and we're in charge of the load balancing, service mesh, and service discovery at Criteo.
Today, I will walk you through our journey of automating and improving our load balancing stack using HAProxy, the challenges we faced, and how we addressed them. I will start by telling you a bit about us, and then there will be two parts:
Automation to reduce HAProxy reloads, TLS certificate automation, and service provisioning
CPU usage reduction using TLS resumption and CPU optimization
So, who are we?

Criteo is the largest independent AdTech company, and was founded in 2005 in France. The company operates in 19 offices and has more than 3,500 employees. We participate in about 9 billion bid requests per day.

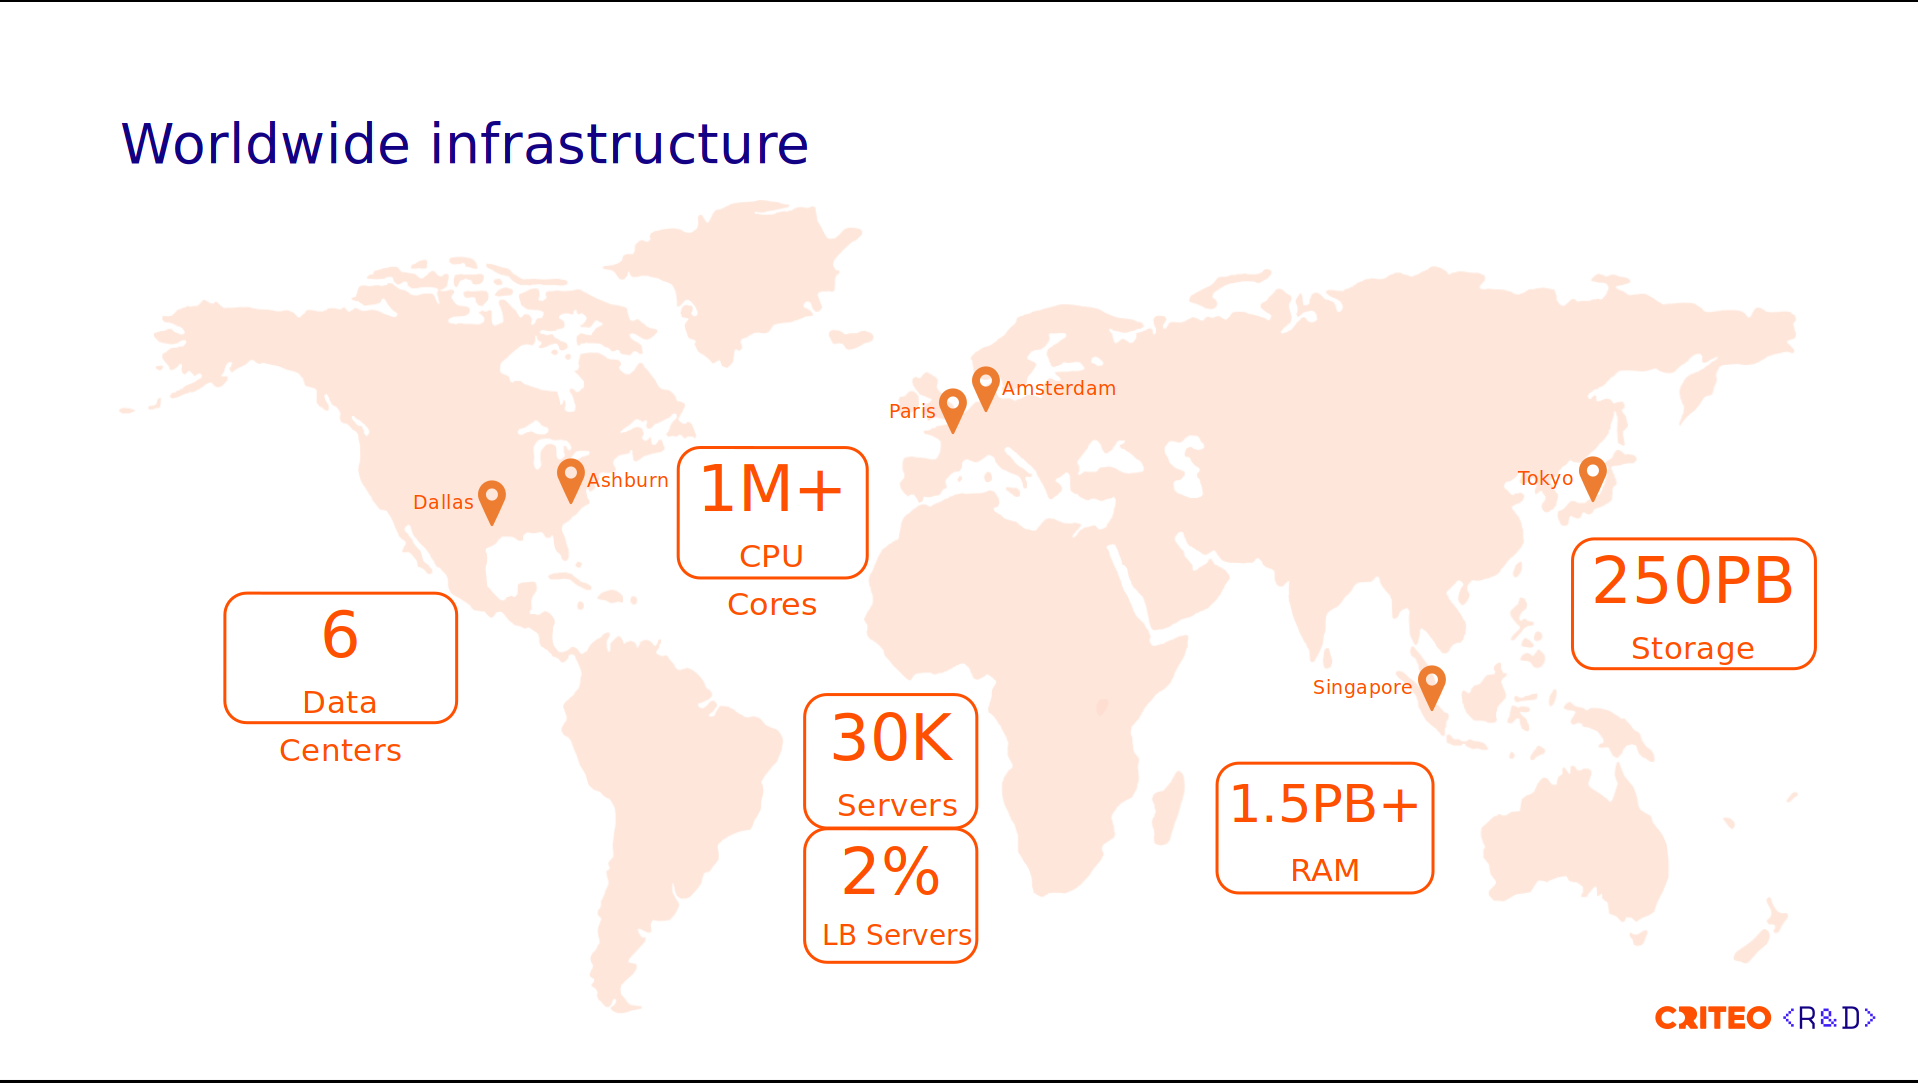
To do so, we need to have the right infrastructure, so the foundation of our business is the infrastructure. We're not a cloud-based company; we have our own bare-metal infrastructure that spans six data centers across three continents.
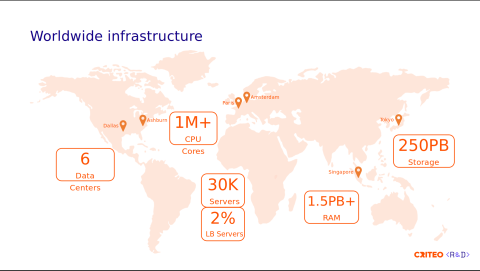
We handle more than one million CPU cores and have 30,000 servers. Of those servers, 2% are dedicated to load balancers.
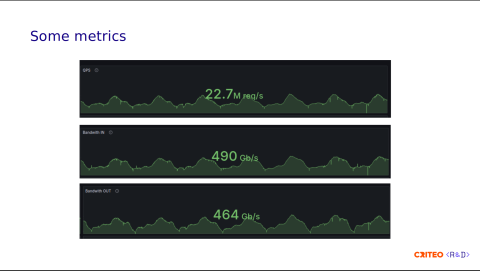
Here are a few more metrics on the load balancer side. We receive a lot of bidding requests. We handle roughly 23 million requests per second, with ingress at 990 gigabits per second and egress at 970 gigabits per second. These requests mainly consist of images we display on the internet.
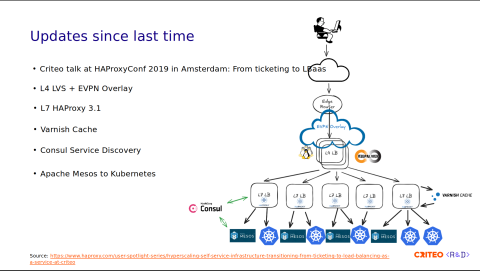
At HAProxyConf 2019, we talked about how we moved from a ticketing system to a load balancer as a service (LBaaS). We discussed how we used automation to move from a vendor-locked, large load balancer appliance to many HAProxy instances. At that time, we were running HAProxy 2.0.
Since then, as you can see in this illustration, a lot of things have gained maturity. We have fully replaced the L4 stack with LVS. We've started using EVPN Overlay to fix traffic imbalances. We are still using HAProxy for the L7 stack, and we are running on HAProxy 3.1 today. We've introduced a caching system using Varnish, we provide a local CDN to our internal customers, and we're still using Consul for the service discovery.
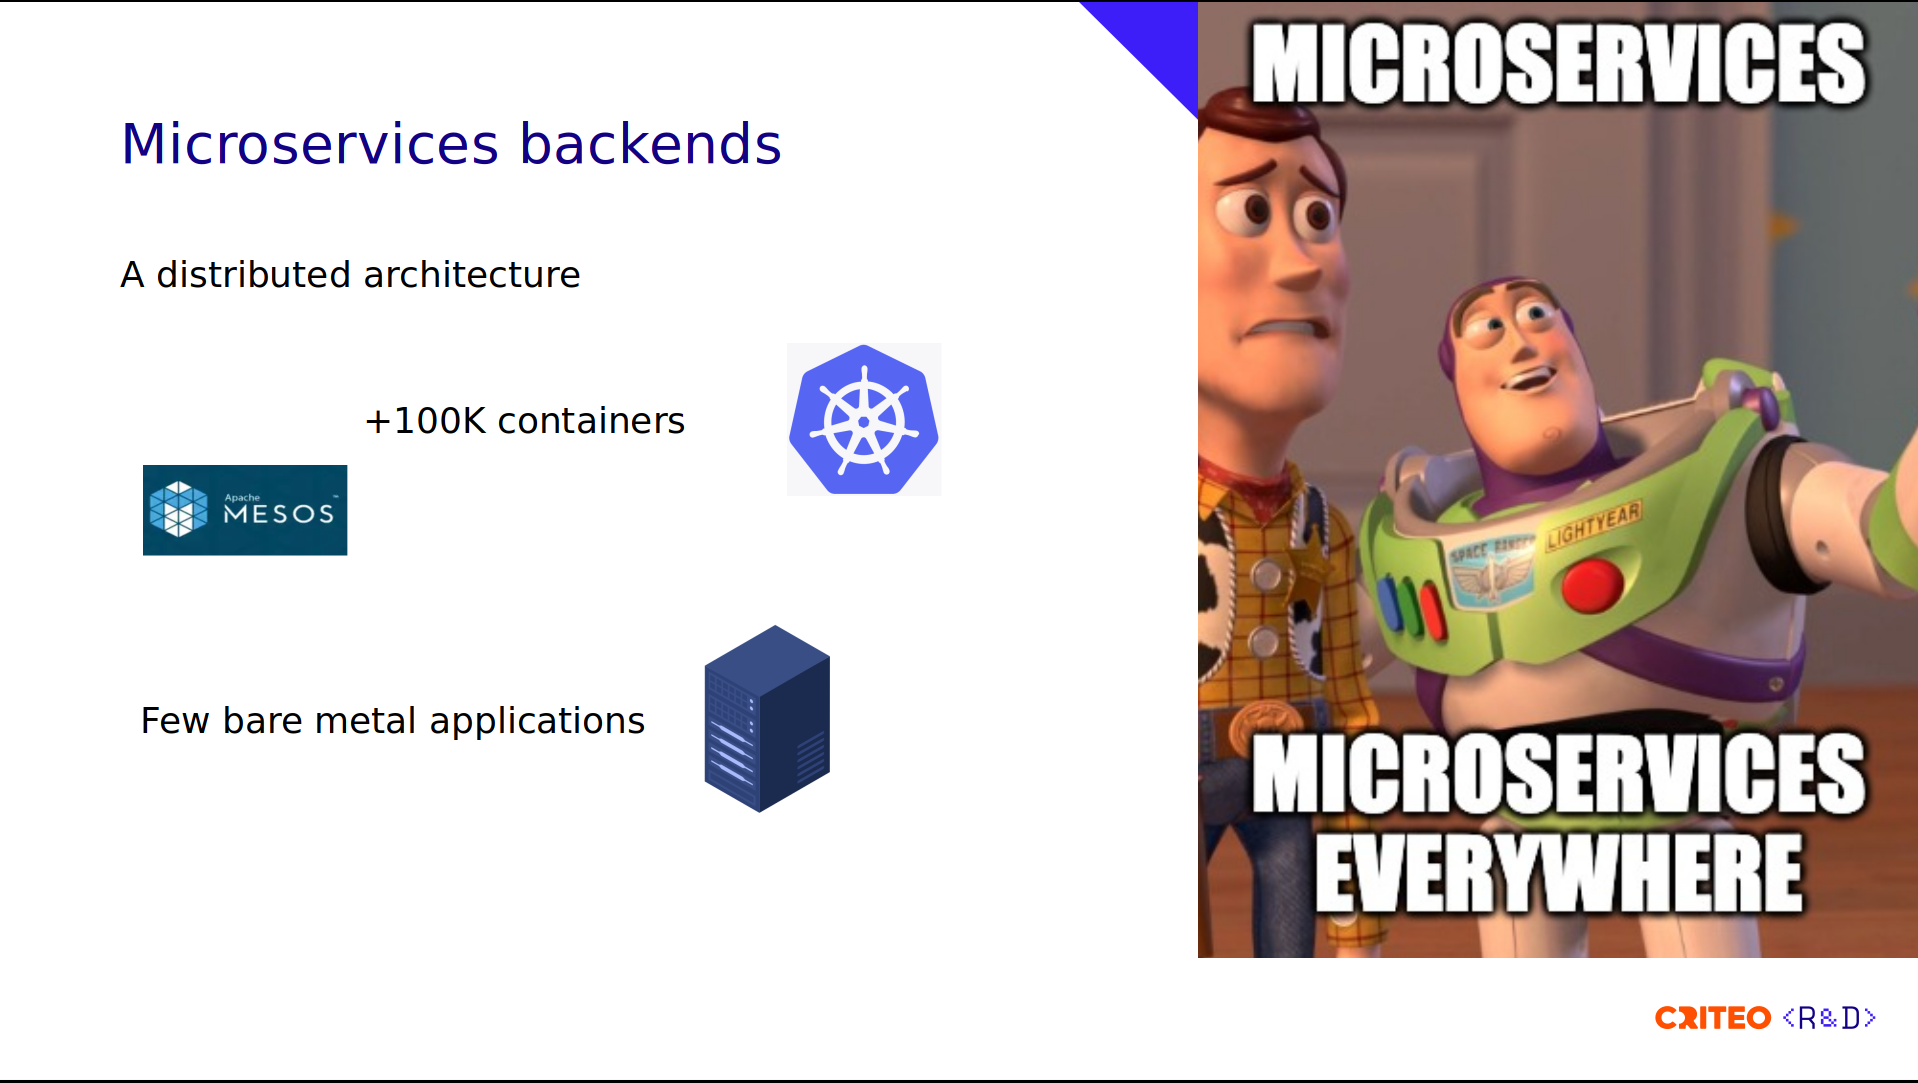
As for the containers, we have some Apache Mesos and Kubernetes containers.

For the backends, we have a distributed architecture with tons of microservices. We have more than 100,000 containers running on Kubernetes and Apache Mesos. We are currently in the process of migrating everything from Mesos to Kubernetes, and we still have a few applications running on bare metal nodes.
Our end goal is to provide the best quality for the load balancer as a service (LBaaS). Therefore, we are constantly looking to increase automation and performance.
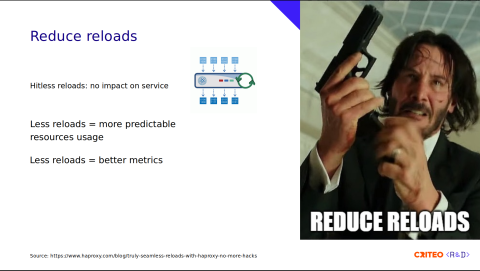
HAProxy version 1.8 introduced the seamless, or hitless reload, which improves the user experience, as it avoids downtime. You can find more information at this link.
Reloads come with a cost. It requires CPU and memory to handle the exchange between the old and the new processes. Reloading under heavy traffic conditions could impact the load balancing performance. Therefore, the less reloads you have, the better the performance is. Also, it has an impact on the Prometheus counters, which are reset. (There's work in progress by the HAProxy team to fix the metrics).

In the next part, I will talk to you about automation to reduce reloads with TLS certificate automation and server provisioning.

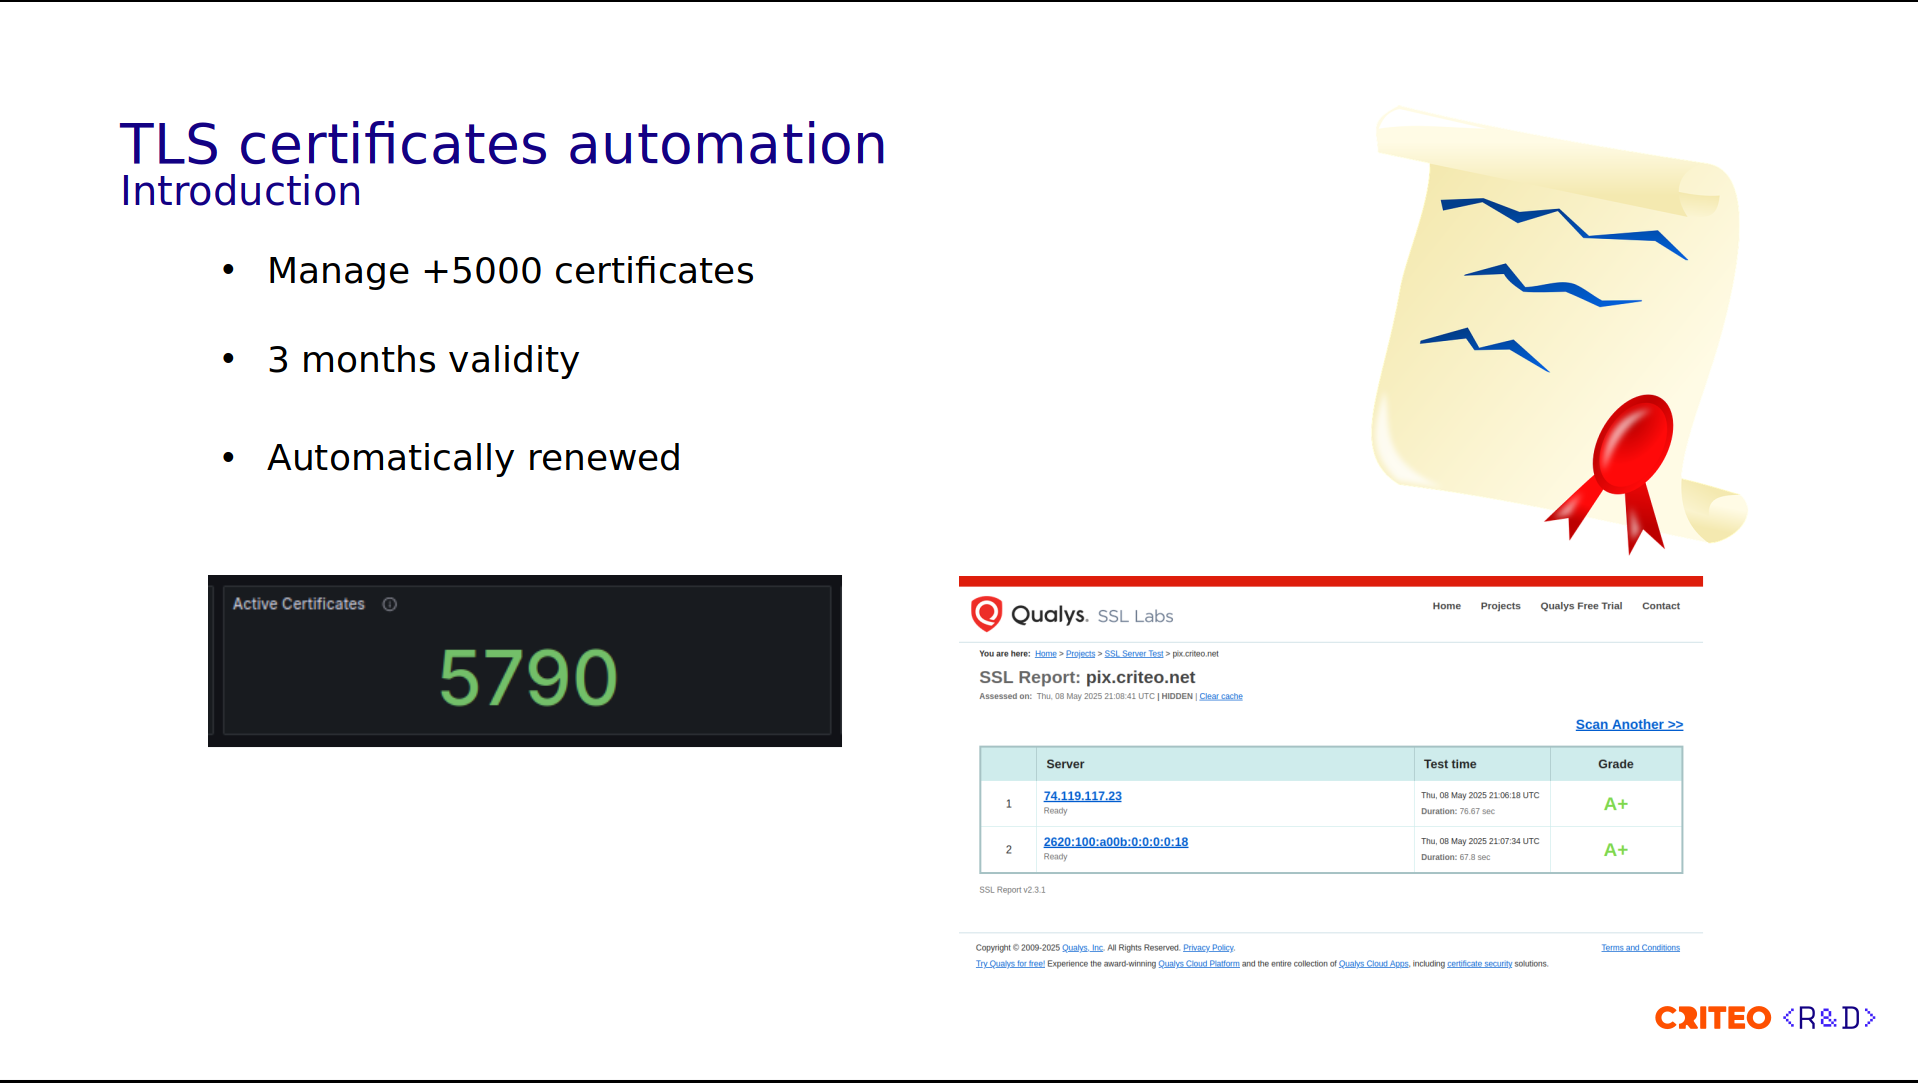
We manage more than 5,000 certificates for which we apply a three-month validity. The certificates are automatically renewed before the expiration date. We're always trying to keep our stack up-to-date security-wise, as confirmed by the A+ grade given by Qualys SSL Labs.
This can sound pretty complex, but we have automated all of these parts. To achieve this, the workflow is as follows:
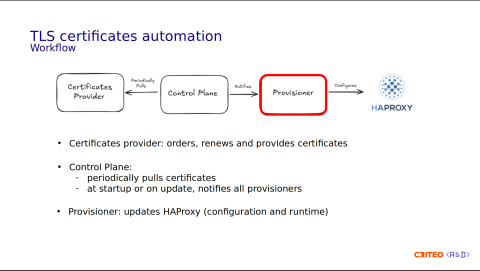
We have the Certificate Provider process, which is in charge of the certificates' lifecycle. It interconnects with third-party providers like DigiCert or Let's Encrypt.
The Control Plane's role is to periodically pull (renew) the certificates and notify the Provisioners of any new events. Those two components are running as microservices on Kubernetes.
The last component is the Provisioner, which runs on the same server as HAProxy. Its main role is configuring the local HAProxy instance statically (configuration) and dynamically (runtime).
Let's now have a look at the configuration.
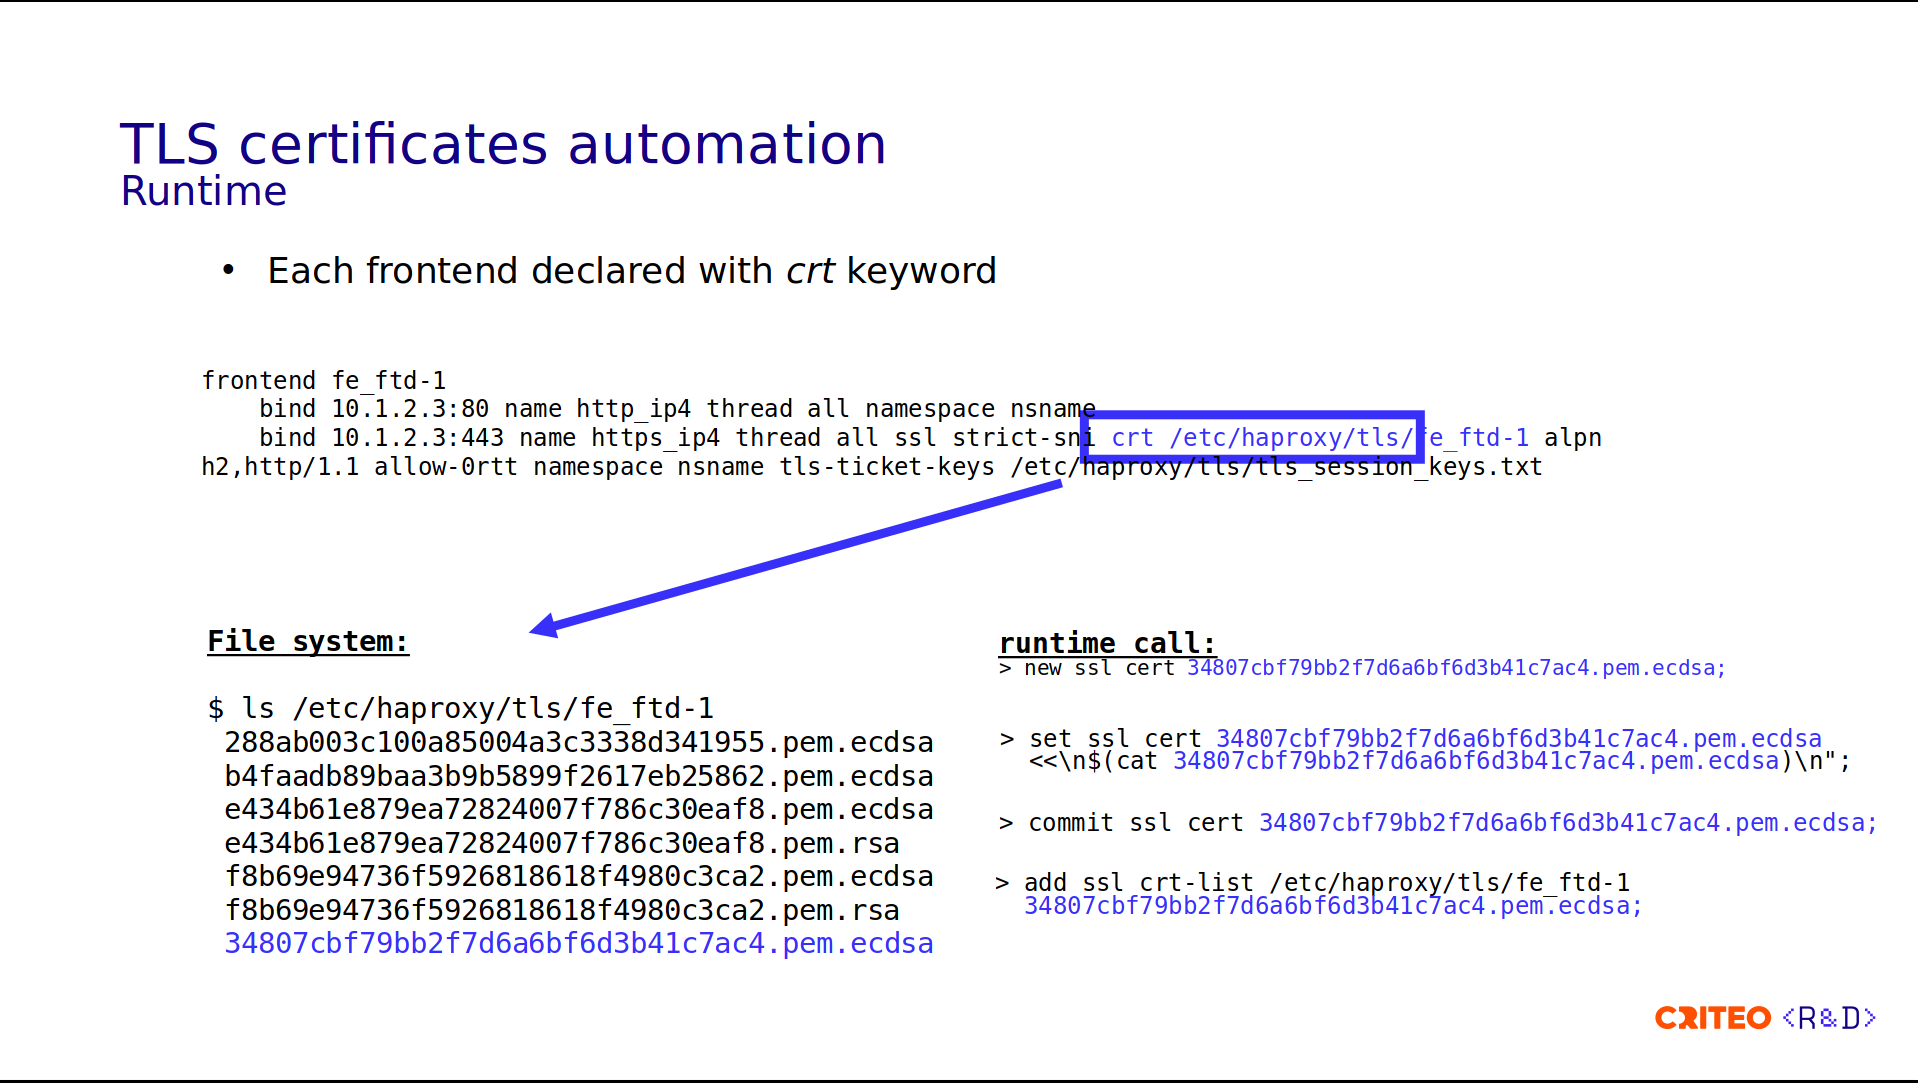
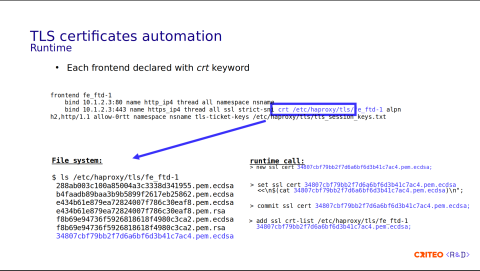
The certificate configuration is done at the front-end level using the crt keyword. And here's an example with the front-end named fe_ftd-1.
frontend fe_ftd-1
  bind 10.1.2.3:80 name http_ip4 thread all namespace nsname
  bind 10.1.2.3:443 name https_ip4 thread all ssl strict-sni crt /etc/haproxy/tls/fe_ftd-1 alpn h2,http/1.1 allow-0rtt namespace nsname tls-ticket-keys /etc/haproxy/tls/tls_session_keys.txt
On the HTTPS bind line, you can see that there is a crt parameter pointing to /etc/haproxy/tls/ftd1. This refers to a folder in the file system containing all the certificates.
You might be wondering why we have so many files. This is because:
There could be different types of signatures (ECDSA and RSA).
They can contain different domains.
You can also have a more specific and a less specific certificate or, for example, a wildcard.
There could also be both the older and newer certificates, because when we renew the certificates, we renew them when the old one is still valid.
By passing a crt keyword to HAProxy, HAProxy will choose the right certificate for the incoming request.
How does it work at runtime?
Let's say we receive the certificate in blue for this front end.
First, we write it into the file system. The file system has to be in sync with the runtime. If the two are not in sync, you might lose your data when the HAProxy process reloads or restarts.
Then, you need to allocate the certificate using the new SSL crt command, followed by the set ssl cert command, which contains the certificate's contents.
Then, since it's a transaction, you need to commit the transaction using commit ssl cert.
The final step is to add the certificate to the
crt-listusing add ssl crt-list. Here,/etc/haproxy/tls/ftd1corresponds to the folder's name.
You have four steps in total. Something else I didn't mention here is that the certificate provider process is in charge of cleaning up unused and expired certificates in the file system.
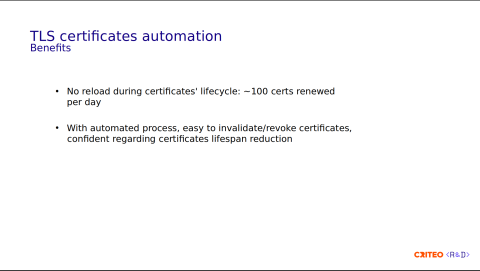
What are the benefits?
This drastically reduced our process reload requirements, and we have no reloads during renewal for these more than 5,000 certificates. With the certificates having different expiration dates, we have roughly 100 renewals per day.
Thanks to our automated process, we have control over our certificates. For example, it's easy to invalidate certificates. We are pretty confident with the lifespan reduction, which will make the 47-day validity reduction easier in 2029.
Now let's go on to the second part: reducing reloads and service provisioning.

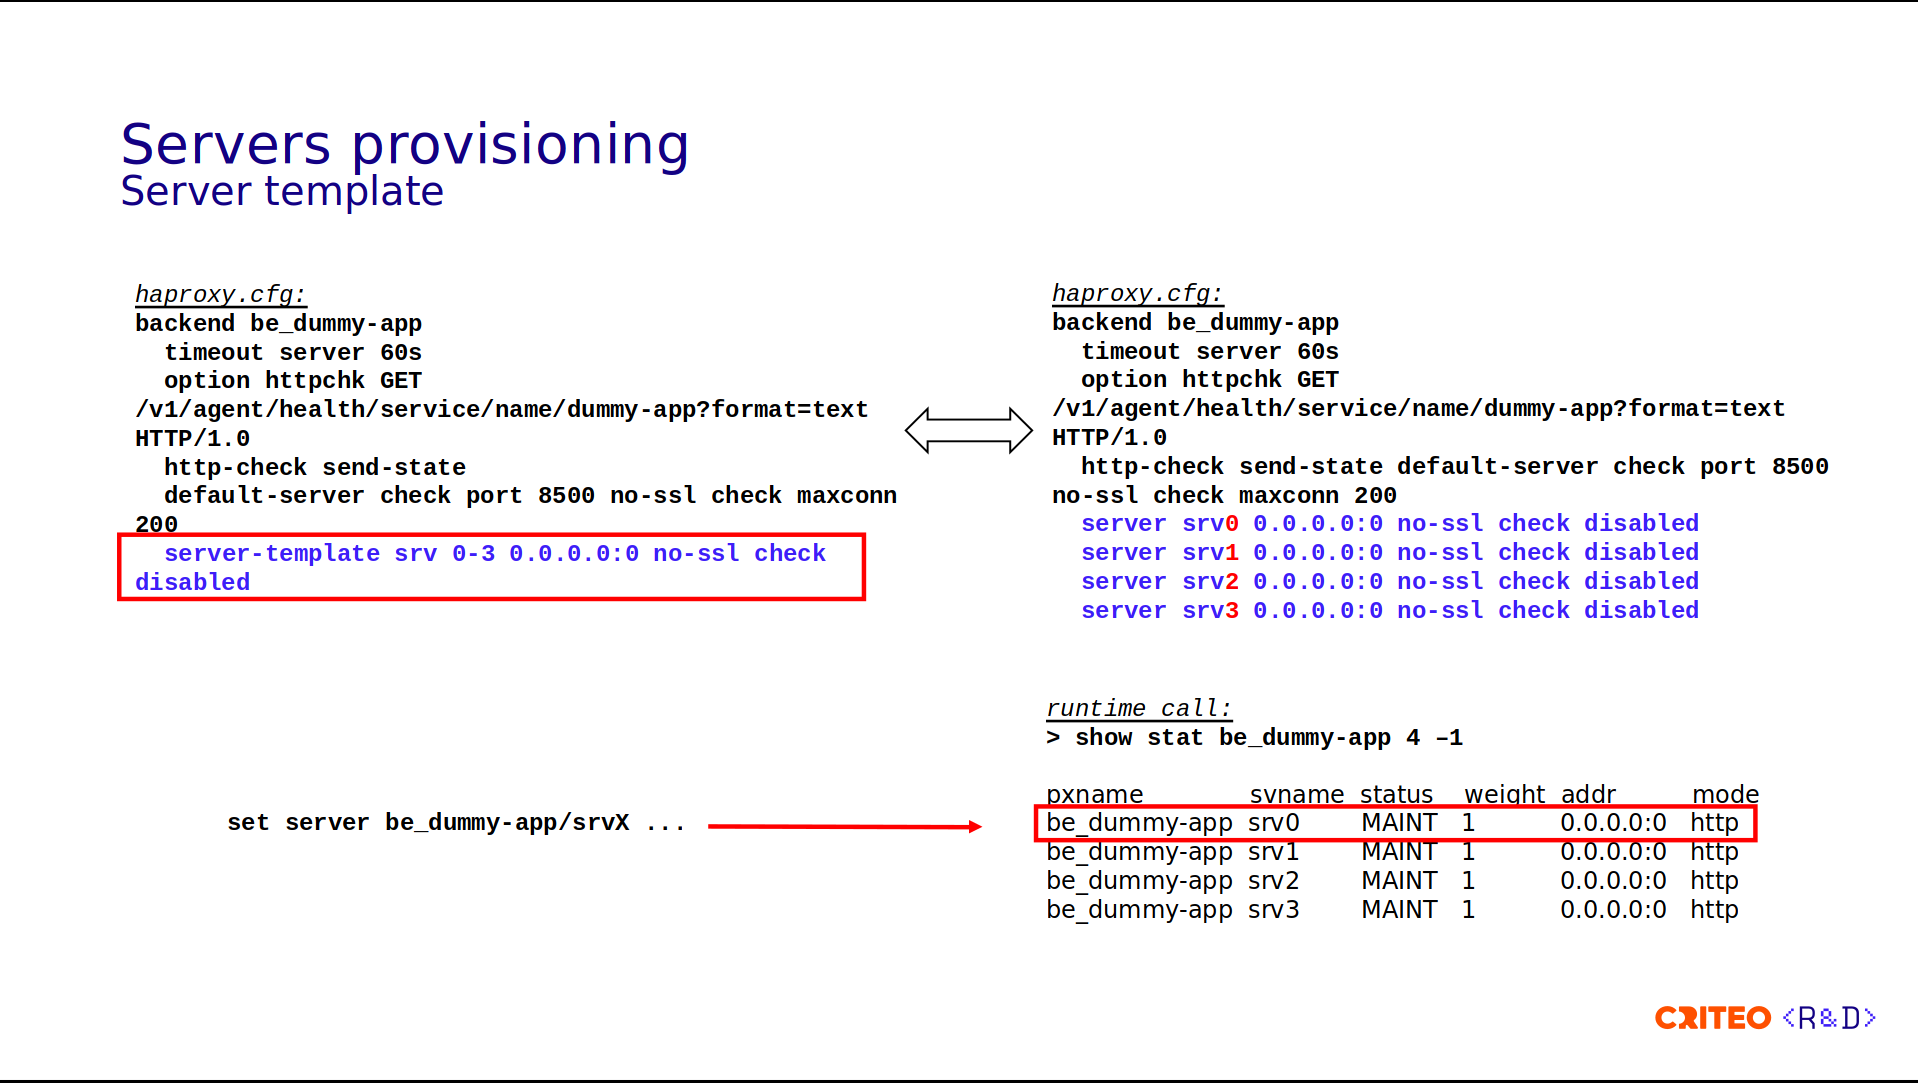
Since HAProxy 1.8, the way to provision services is to use server templates.
What are server templates? They're basically placeholders that indicate to HAProxy that a certain number of servers should be pre-provisioned for a given backend.
In this example, you can see that the backend be_dummy-app has pre-allocated four servers from index 0 to 3.
backend be_dummy-app
  timeout server 60s
  option httpchk GET /v1/agent/health/service/name/dummy-app?format=text HTTP/1.0
  http-check send-state default-server check port 8500 no-ssl check maxconn 200
  server-template srv 0-3 0.0.0.0:0 no-ssl check disabled
This can look confusing at first, but if you expand the configuration, this is equivalent to the following:
  server srv0 0.0.0.0:0 no-ssl check disabled
  server srv1 0.0.0.0:0 no-ssl check disabled
  server srv2 0.0.0.0:0 no-ssl check disabled
  server srv3 0.0.0.0:0 no-ssl check disabled
Here, you have server 0 to server 3. The server-template srv is a prefix. 0-3 is the index. Therefore, you have srv0, srv1, srv2, srv3.
This is how it looks in output of the runtime call show stat. You have server 0 to server 3 in MAINT state.
To provision a new server, you simply replace an unused server using the set server command.
One of the limitations of this model is that if you fill out all the servers at server 0 to 3, you need to update the server-template to extend the number of servers you can handle, and therefore, you need to reload HAProxy. This solution worked well until our users started using the "autoscaler" for the application.
We began to see the following pattern application/instance-wise.
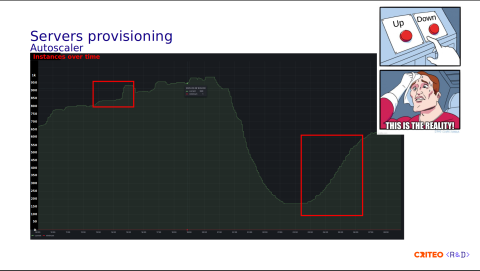
Here, we observe an increase of 100 instances. During the morning, we see an increase from 115 instances to 600. So, you can imagine that using a server-template is not very well adapted for our pattern, as it needs too many reloads.

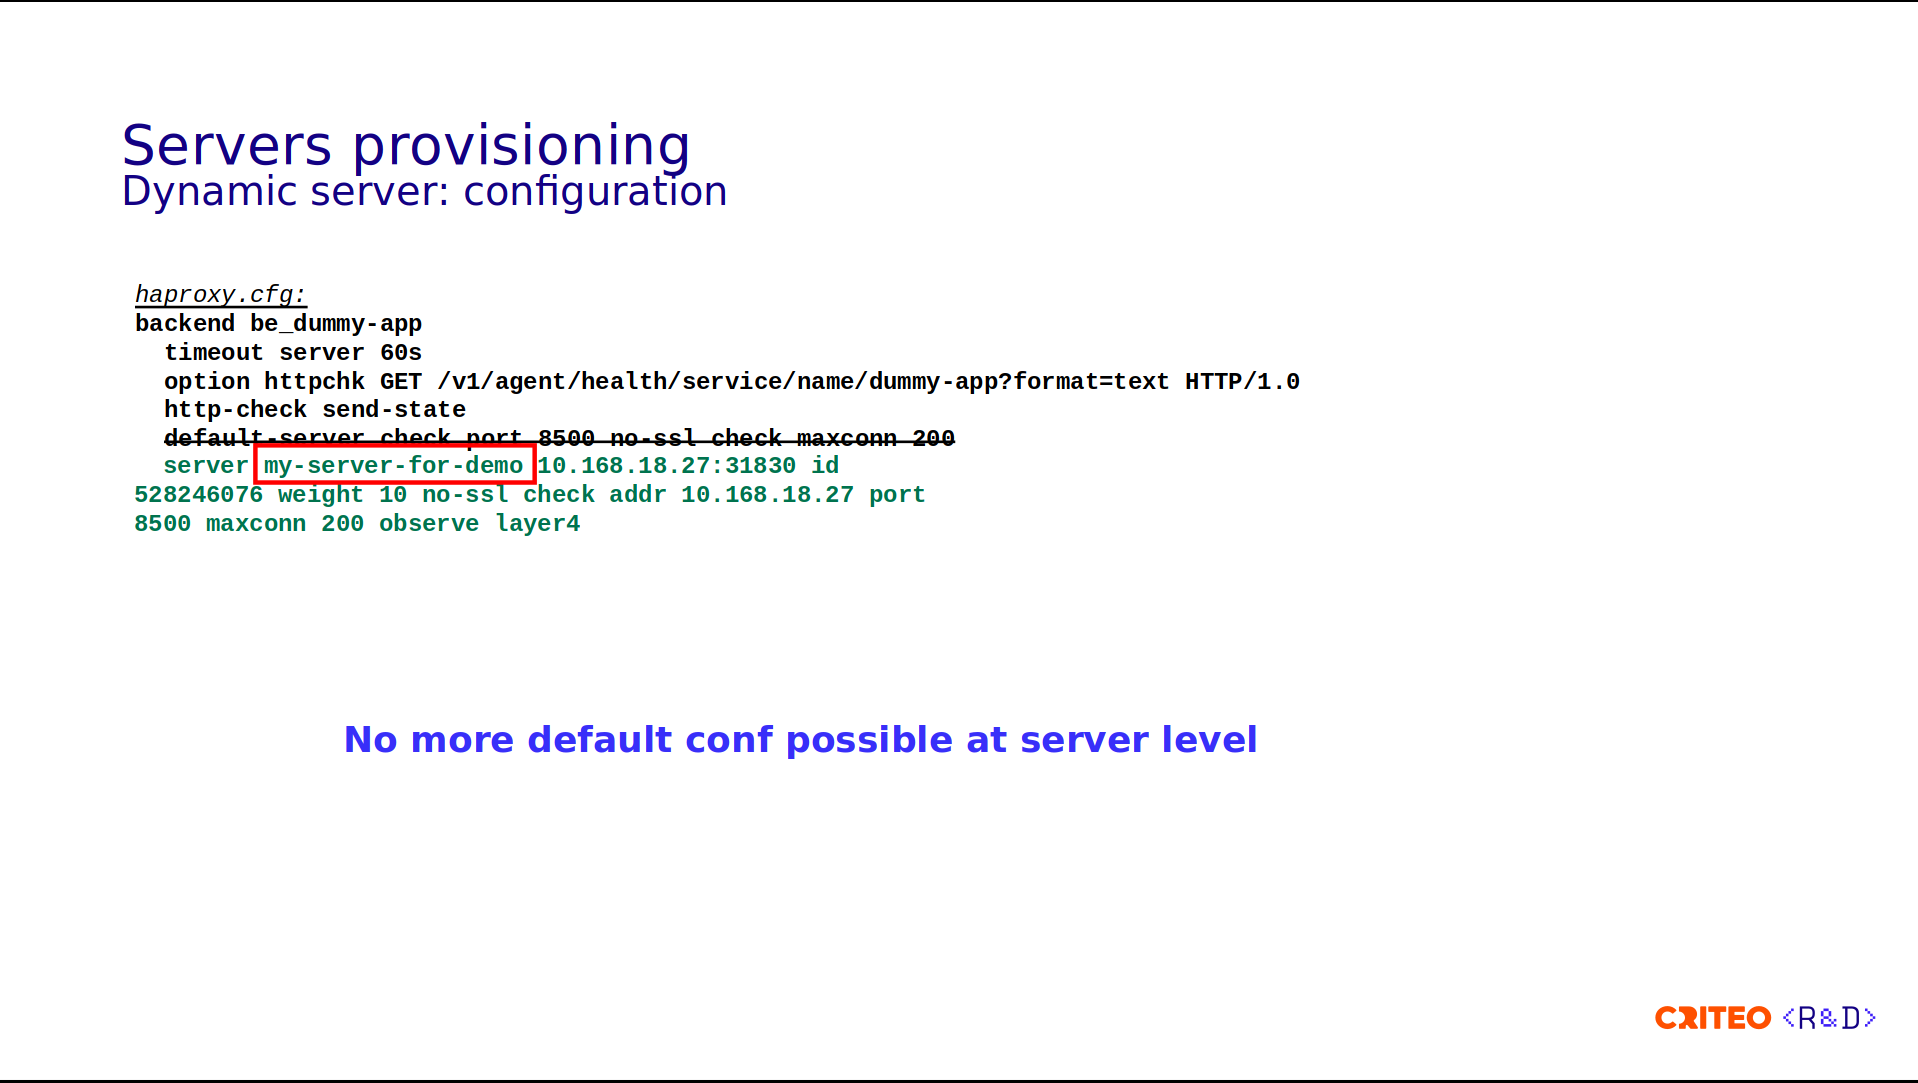
Here is where the dynamic server API comes in. This feature has been available since HAProxy 2.5. Let's now take a look at the configuration part.
First, it was a design choice that there's no more default values, so you can't set the default values. It's possible that for the service, you need to specify all the values at the server line, and therefore you should remove the default server option.
Here, for example, we have inserted a new server with a real name, my-server-for-demo, so there's no more srv plus index. Since there are no default values, you need to put everything here: the weight, the address, the port, maxconn, or whatever.

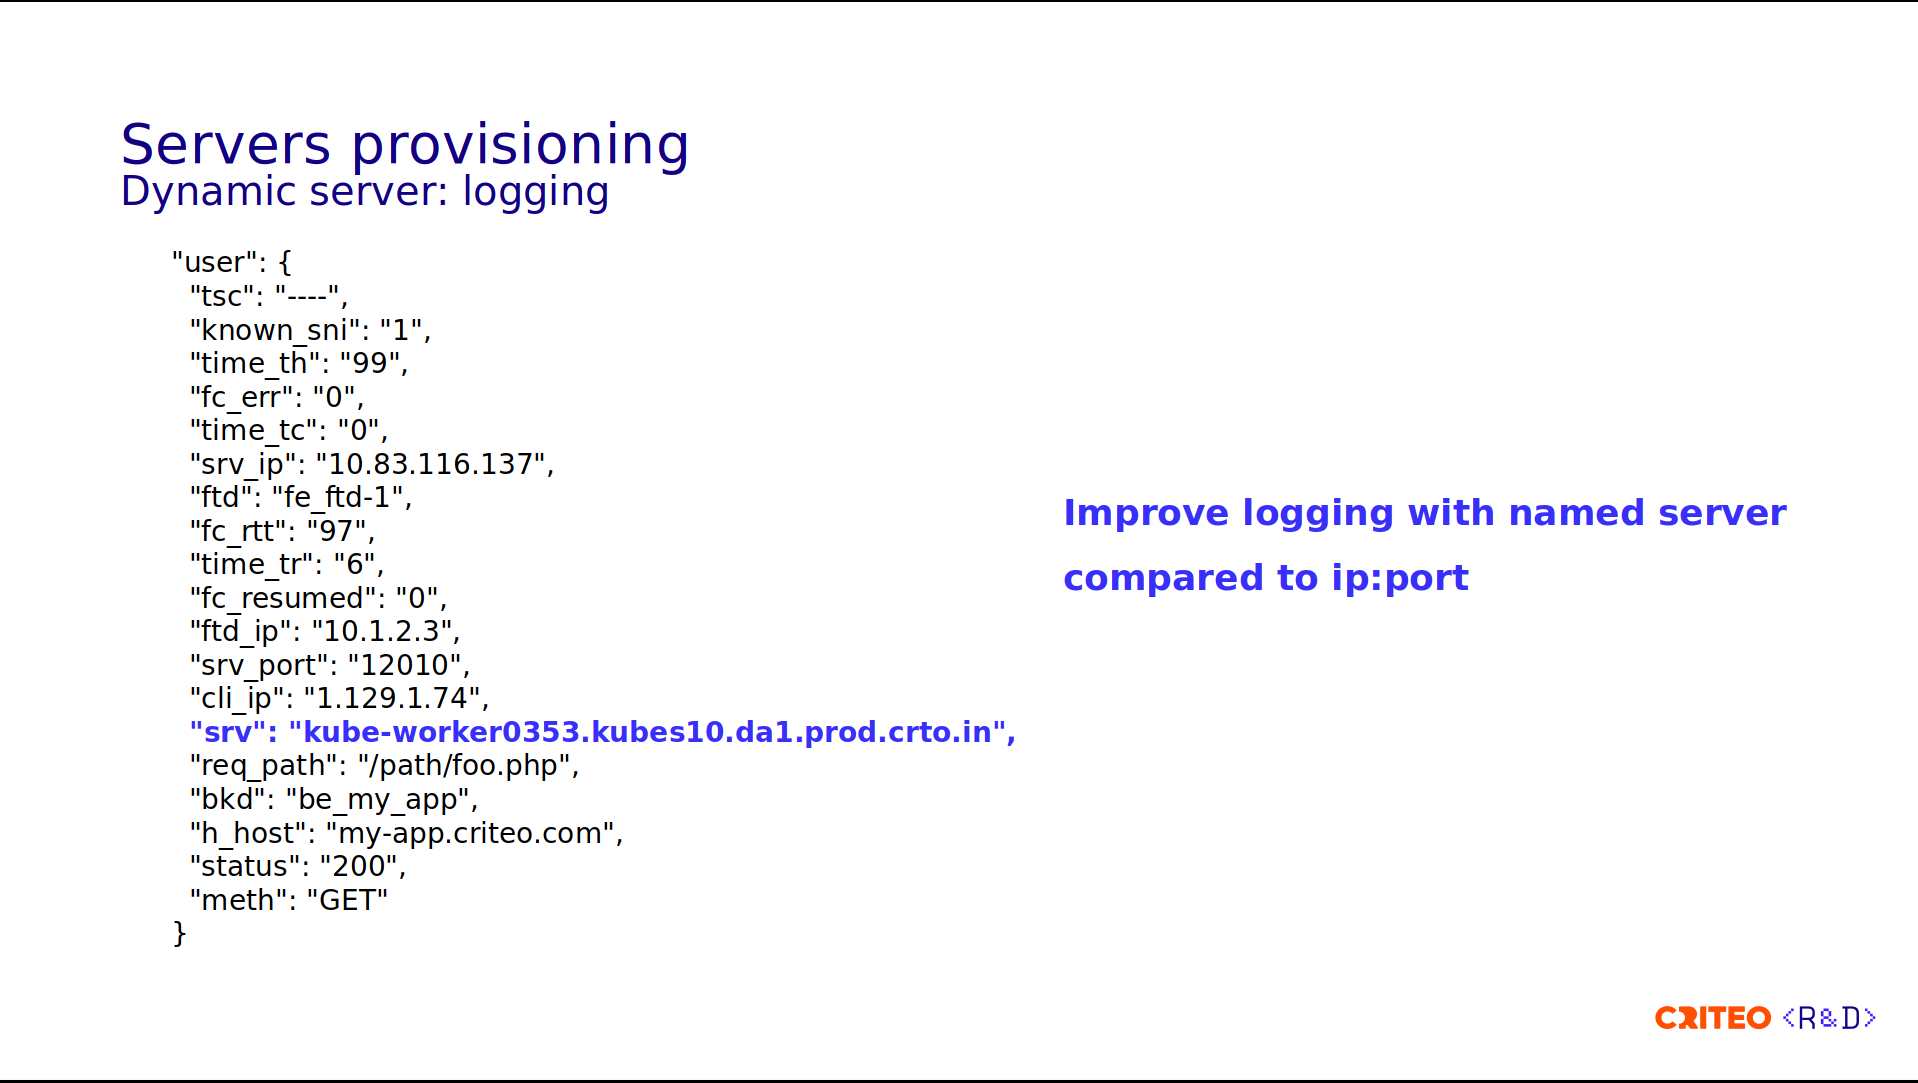
One of the great parts of dynamic servers is that, since we can now have named servers, we can have better logging. In the past, we used to put the IP and the port of the container inserted in the field user.srv, and in the case of issues with the container, it was kind of complicated to find the right physical server to investigate.
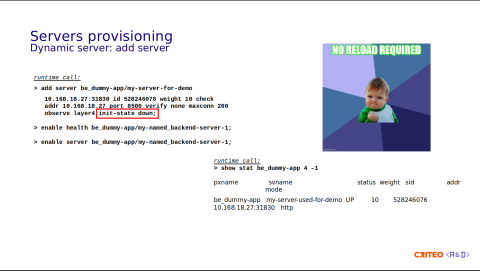
So, let's now try to add the server described two slides ago. The runtime call is done in 3 steps:
First you need to add the server, so during this call you need to pass all the options on the same line. Here we have the address, the weight, the ID, and so on.
Then you need to enable the health checks.
Then you need to enable the server.
Something that is very specific for usage is that we explicitly set the initial state to down and let the health check update the status of the server once it's ready. Here, the server appears instantly on the runtime API call (show stat).
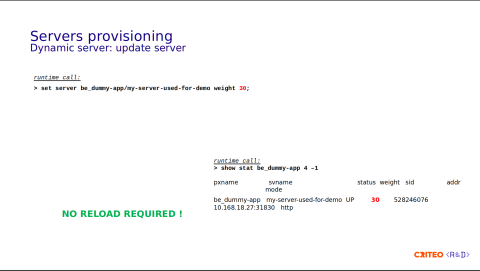
Updating an attribute is as simple as calling the set server command. Here, we updated the weight from 10 to 30 – no reload required.
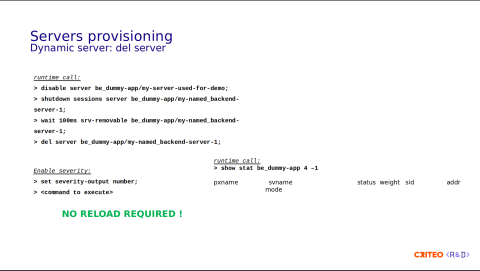
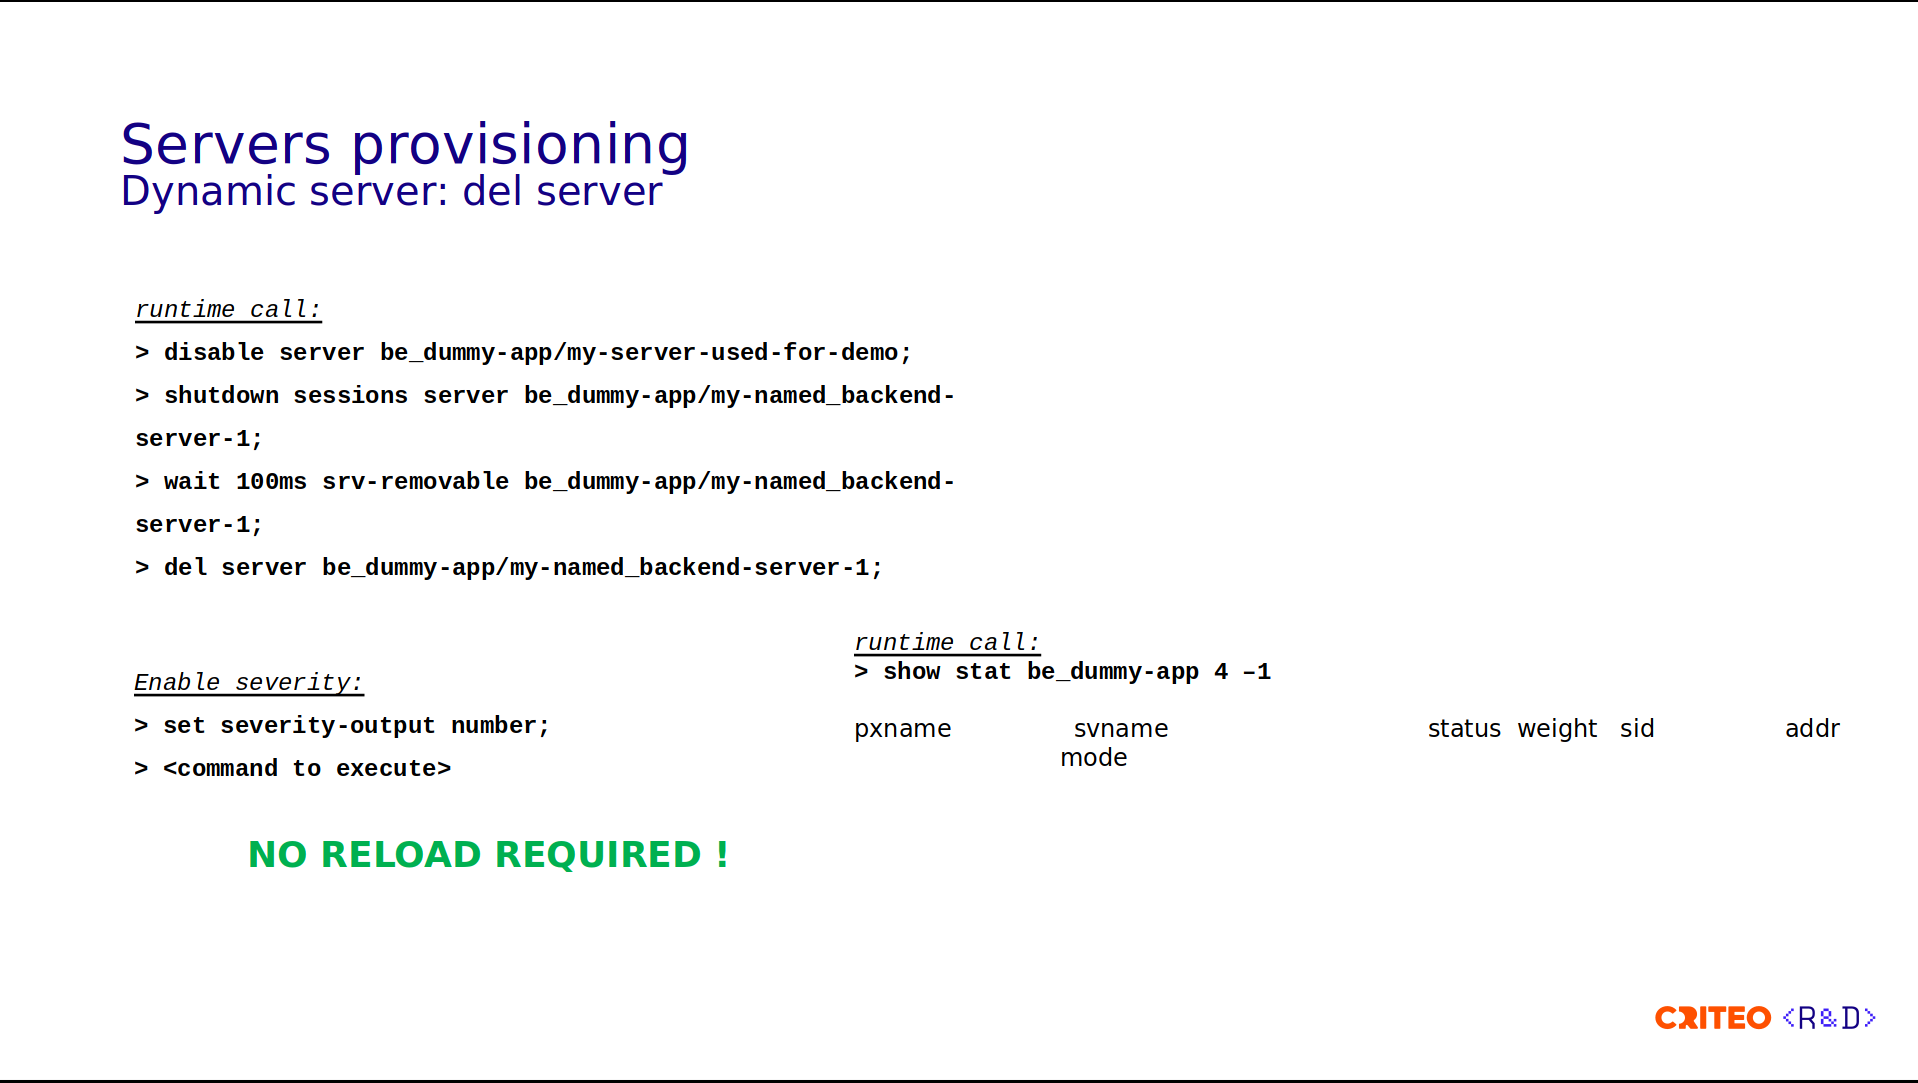
Deleting the server requires a few more steps:
First we disable the server so that it doesn't receive any new connections.
Then we need to shut down the session for all existing sessions for the server.
After that we need to wait for the server to become in removable state. We wait up to 100ms.
Then if the previous command is successful then we can delete the server.
You can see in the runtime API output (show stat) that there's no more server. Something I didn't mention is that we enable the severity as a number, meaning that each command that runs before returns an integer, so something below 3 means that it's in error status, and using the previous error status, we decide whether or not to execute the next command.
I wanted to make a general remark that is valid for any runtime call, not only servers. When you update using the Runtime API, it doesn't update the files on the disk. You need to write all the stuff you pushed into the runtime into the configuration file, or any files, certificates, or whatever. This is to avoid any loss in case of process restart or reload.
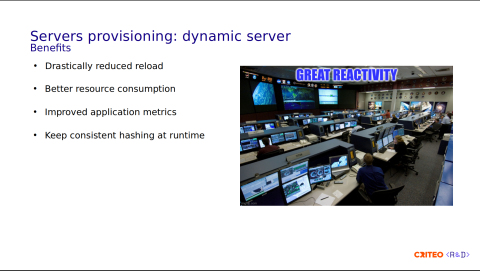
What are the benefits?
We drastically reduced the reloads, which helps to improve the resource consumption. Like I said previously, reloads are expensive and thanks to the dynamic server API we have more predictable resource usage on our system.
This also improves the metrics since reloading resets the previous metrics to 0.
Another big win for us is that we have some Varnish instances and we need to preserve the consistent hashing so every request goes to the same instance for a given path. Therefore, using the dynamic API we're able to set the ID parameter. We faced some issues in this move to dynamic servers and we thank the HAProxy team for helping us fix them very quickly.
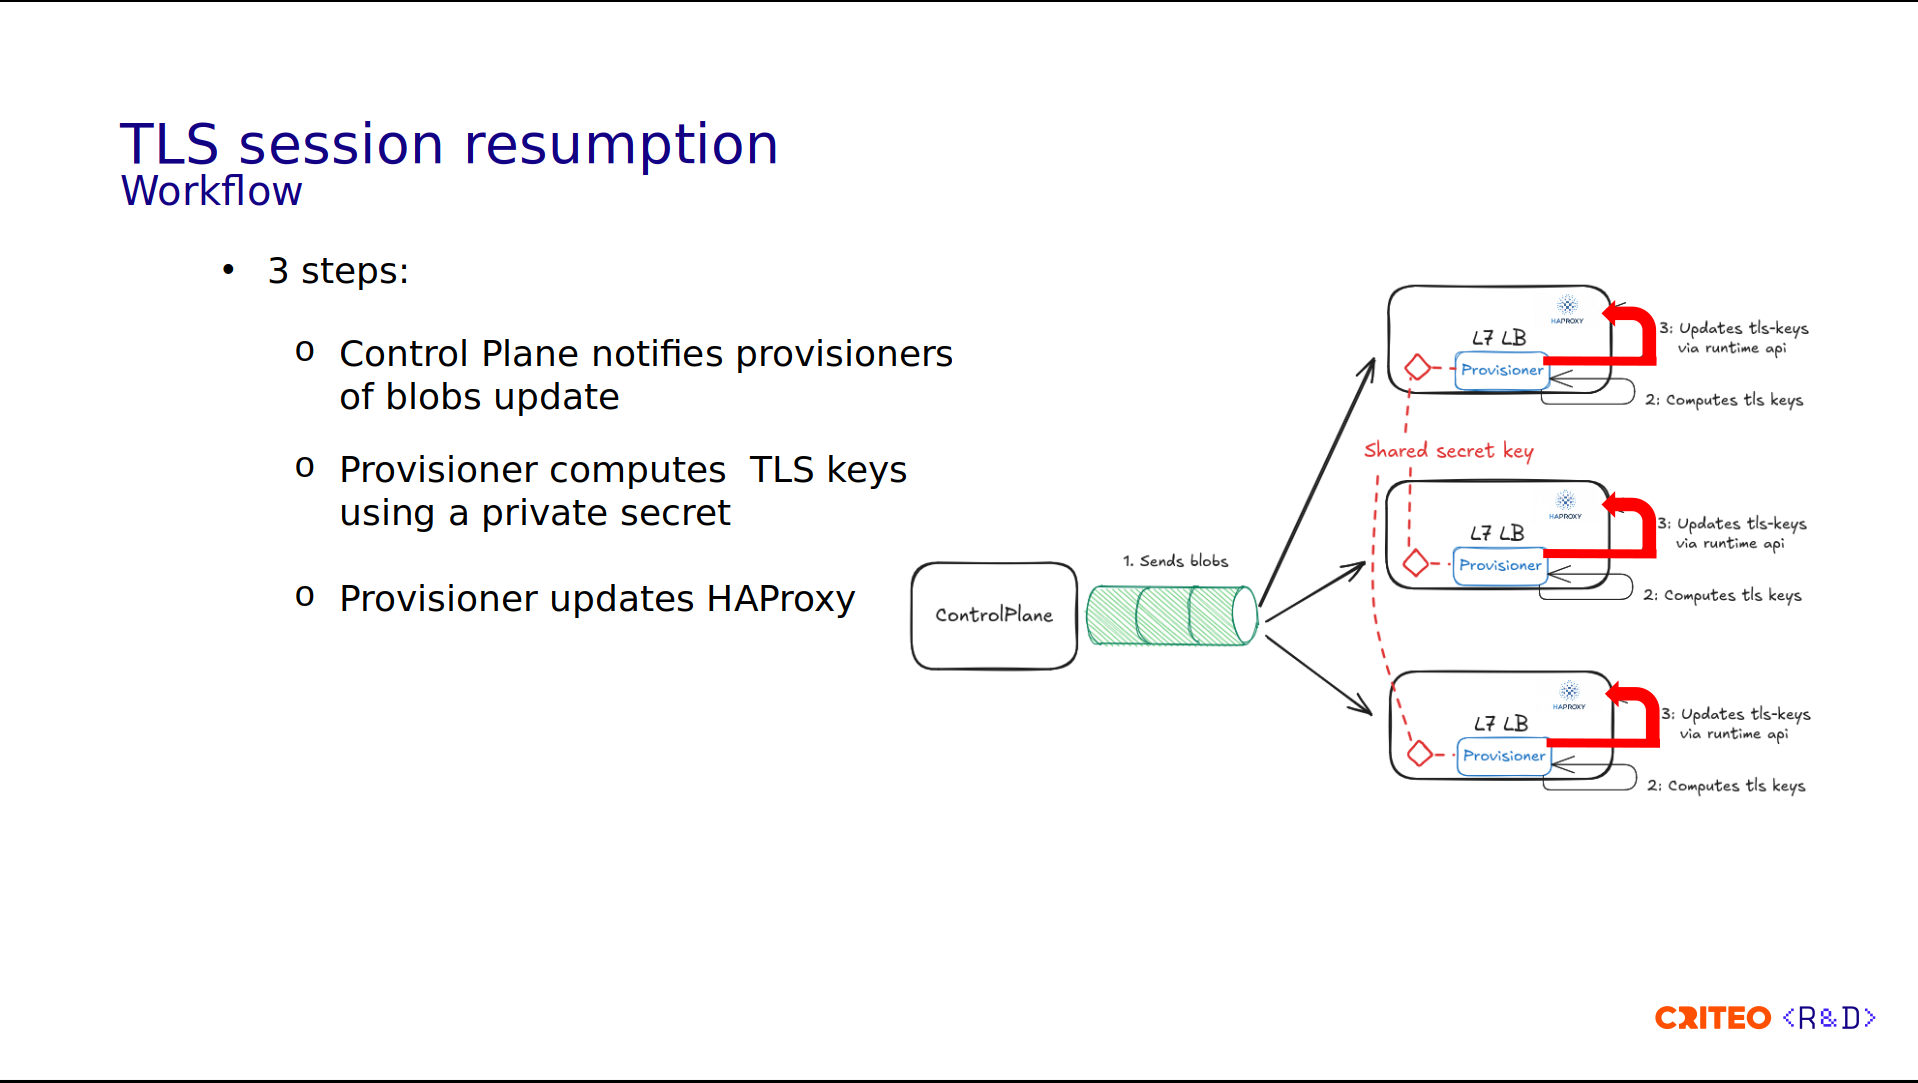
Let's now move on to the next topic: reducing CPU usage. The first topic is using the TLS session resumption. The idea behind TLS resumption is to be able to resume a TLS session despite an HAProxy node being down.
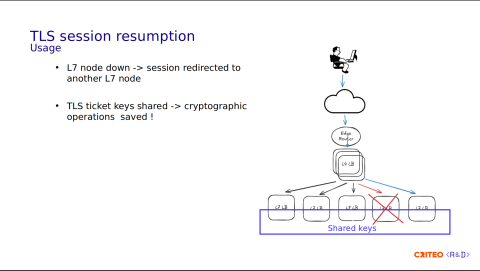
You can see in this diagram that the user request goes to the LB in red. Since the node is unreachable, the request is redirected to the path in blue, and the TLS session is resumed. This is achieved thanks to the keys shared among all of the HAProxy nodes.
Overall, this saves some CPU time due to the reduction of cryptographic operations involved in the full TLS handshake. I think this is something William just mentioned in his talk.

Let's take a look at the process workflow:
The Control Plane generates a blob, and the runtime generates values used as a base for the TLS keys.
Using this blob, each Provisioner computes the TLS keys.
Internally, it uses a shared key among all the Provisioners and updates the local instance of HAProxy using the Runtime API.
In total, we have three steps.
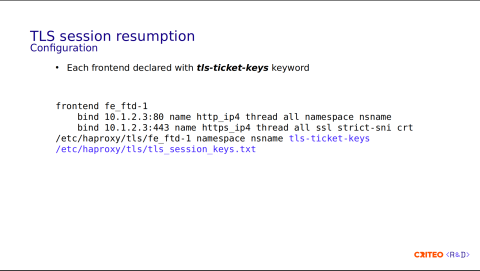
On the config side, to declare the TLS key, simply add the keyword tls-ticket-keys. Here, it should point to the file in the filesystem.
What are the benefits?
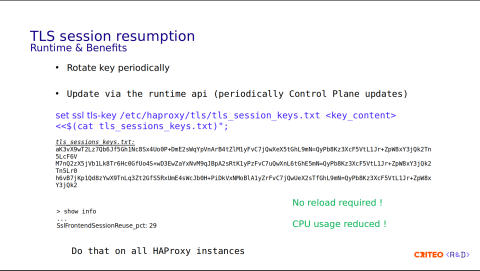
Something important is that the Control Plane rotates the keys periodically. This is highly recommended, or else forward secrecy is compromised. I invite you to read the HAProxy documentation, which clearly explains this part. Following the Control Plane's periodic updates and using the runtime, the command is as simple as set ssl tls-key with the name of the folder and its contents.
Here you have an example of the contents – we have three keys. This has to be done on all the HAProxy instances in the same time frame. The good part is that there's no reload. Here, you can see the percentage of TLS sessions reused. On our side, we have about 30% reuse. I don't have the exact number of CPUs saved, but I invite you to read the blog post, The State of SSL Stacks which has a benchmark on this.

Let's now go to the last part, which is CPU optimization. Let's start with the context.
A CPU is a physical component located on the motherboard. With the quick evolutions in the technologies, multi-core processors, hyperthreading, and the different hardware and software naming schemes, the term CPU is difficult to map to a single concept.

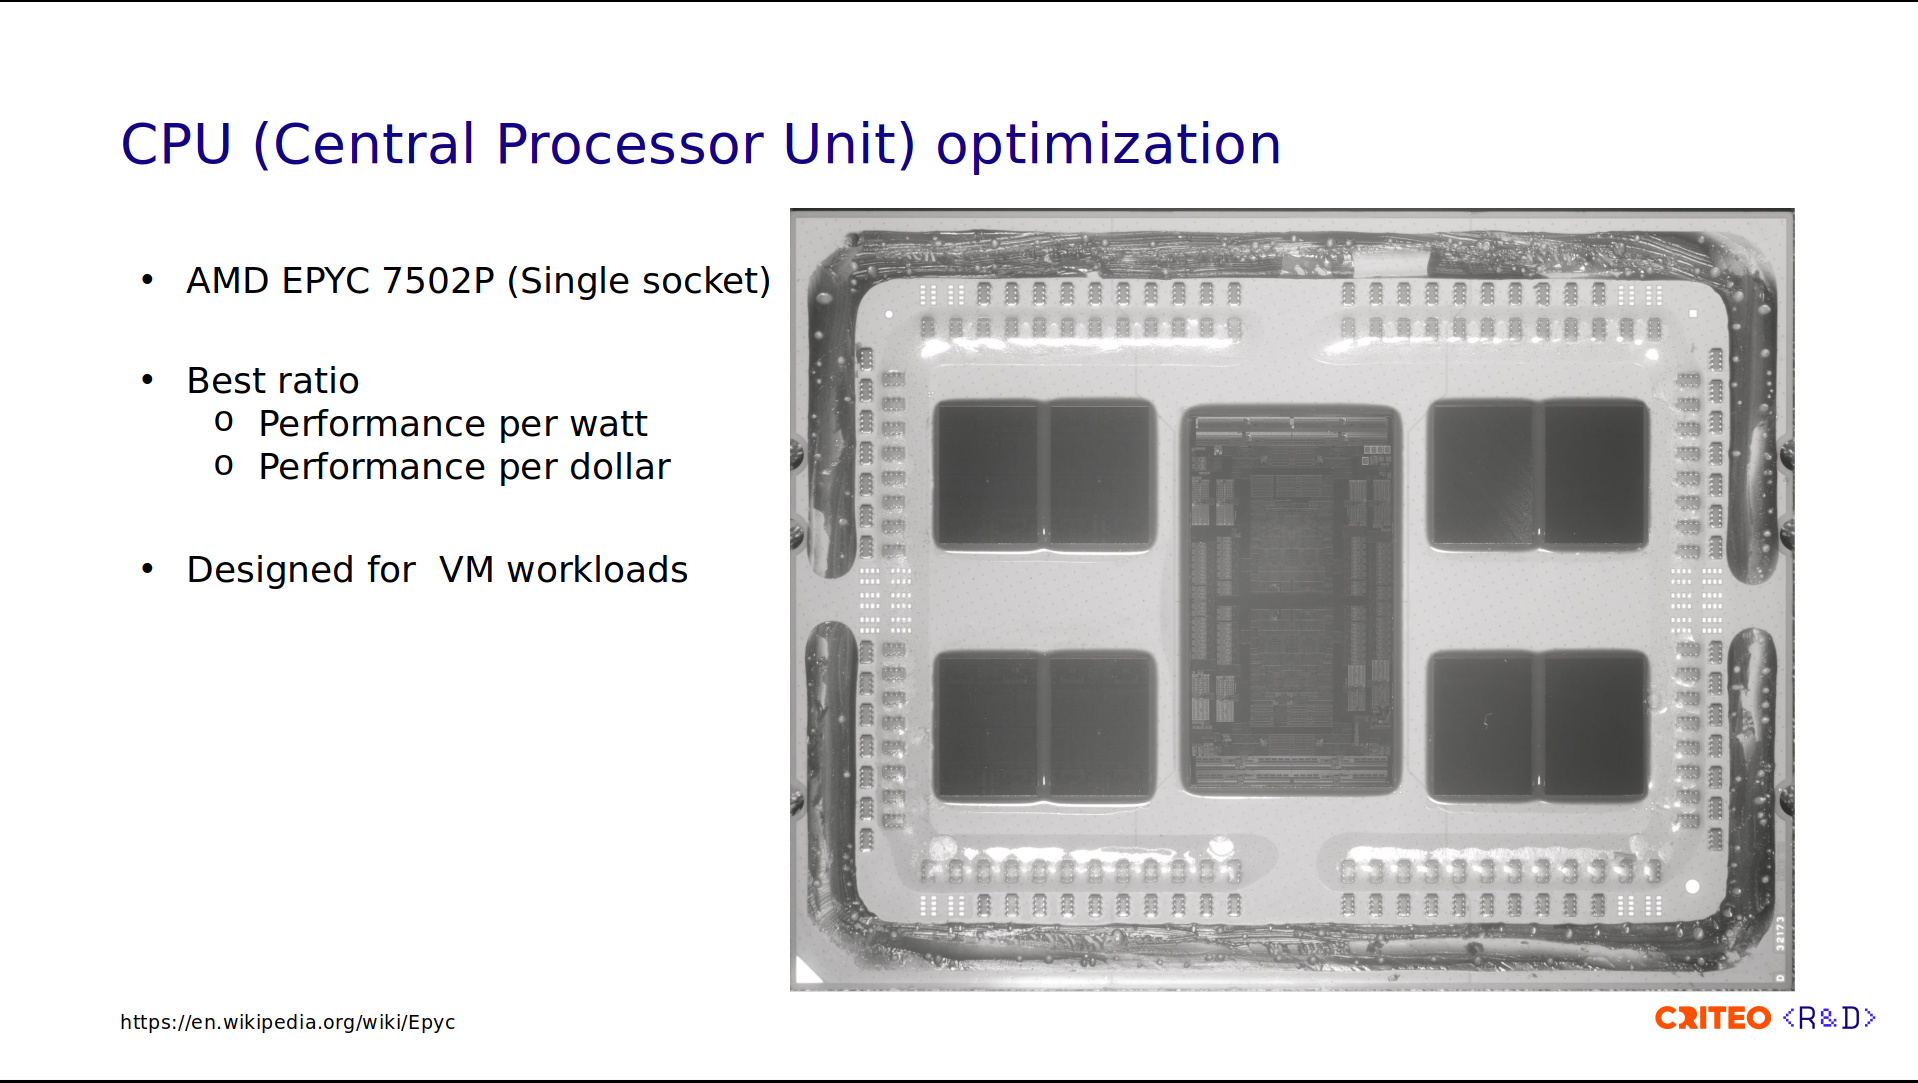
On our servers, we use AMD EPYC 7502P Zen 2 CPUs. The reason for this choice is to have the best power, performance, and cost ratio. This CPU is well adapted to virtualization and high-performance computing workloads.
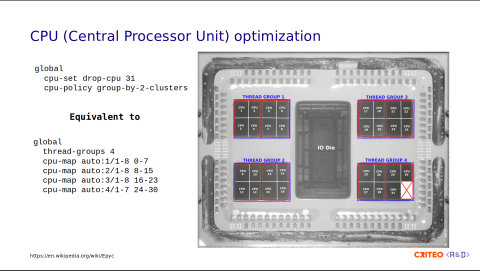
In this image, you can see a near-infrared photograph of the CPU. Let's now dissect the different parts.
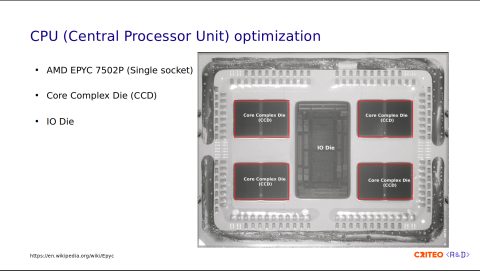
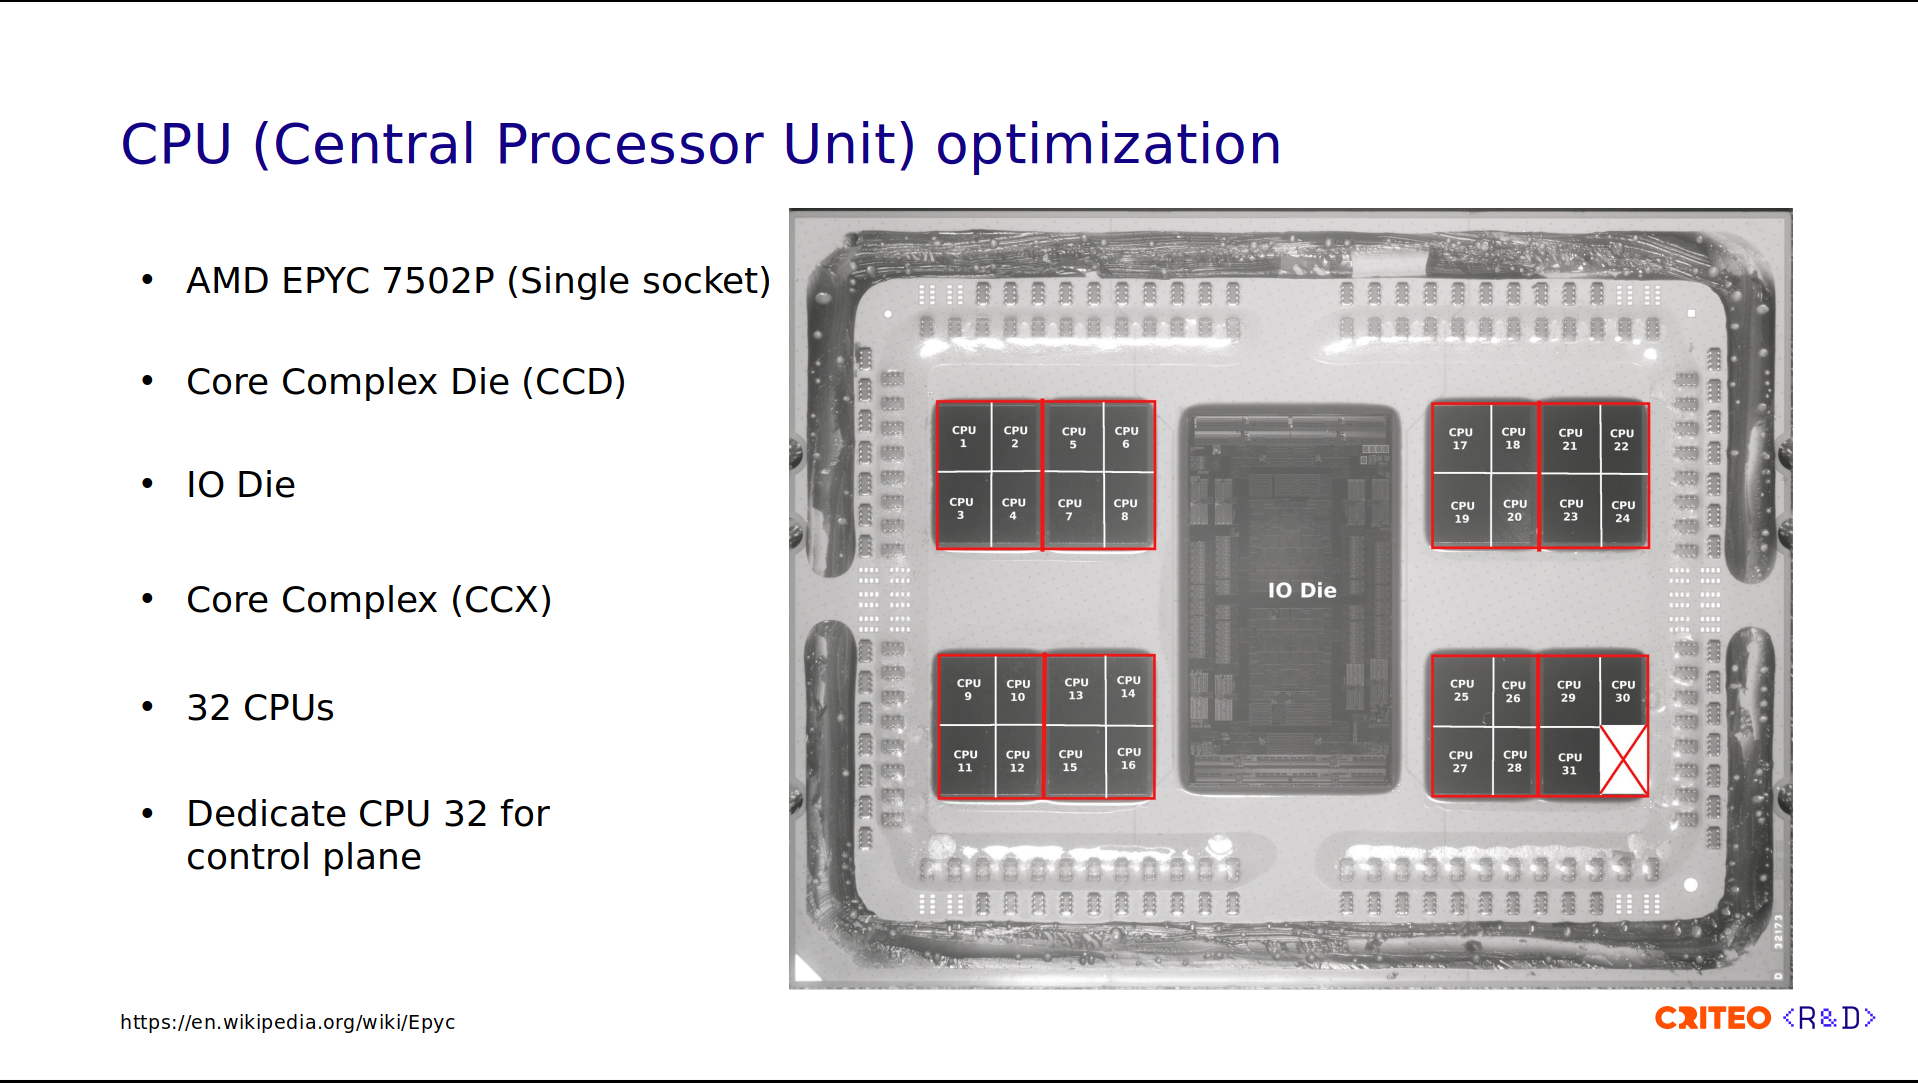
If you look at the image I highlighted in red, there are two parts. The first part is the core complex die (CCD). These are the chiplets that contain up to 8 CPU cores. They provide computing power. In the middle, there is the I/O die. It is equipped with no cores; it only functions to connect CPU cores to memory, storage, and other devices, and it ties the four CCDs together.
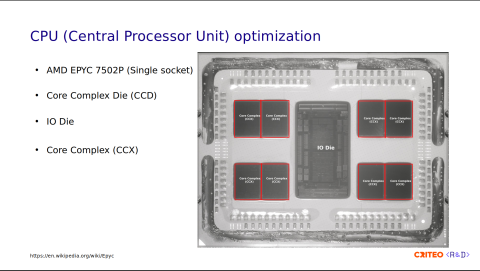
The CCDs are composed of core complexes (CCX), with two per CCD. The CCX is a group of cores within a CCD that share a cache. This allows fast data sharing between cores of the same CCX.
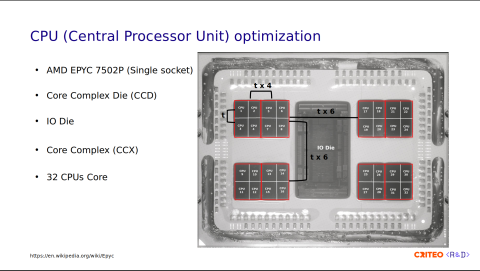
Each CCX contains four CPU cores. These are numbered 1 to 4 on the left and from 29 to 32 on the right. You might wonder why I am showing you all of this. This is because sharing data across CPUs is expensive. If you consider t as the data latency between two CPUs in the same CCX, sharing data across CPU/CCX within the same CCD is 4x higher than that (t x 4), and across different CCDs is 6x higher (t x 6).

On our servers, we dedicated the last CPU, CPU 32 in this photo, to the Control Plane components. I showed you earlier in the architecture diagram that we have some Provisioner processes, which are pinned to CPU 32. We do that to avoid interrupting HAProxy processes running on the other cores.

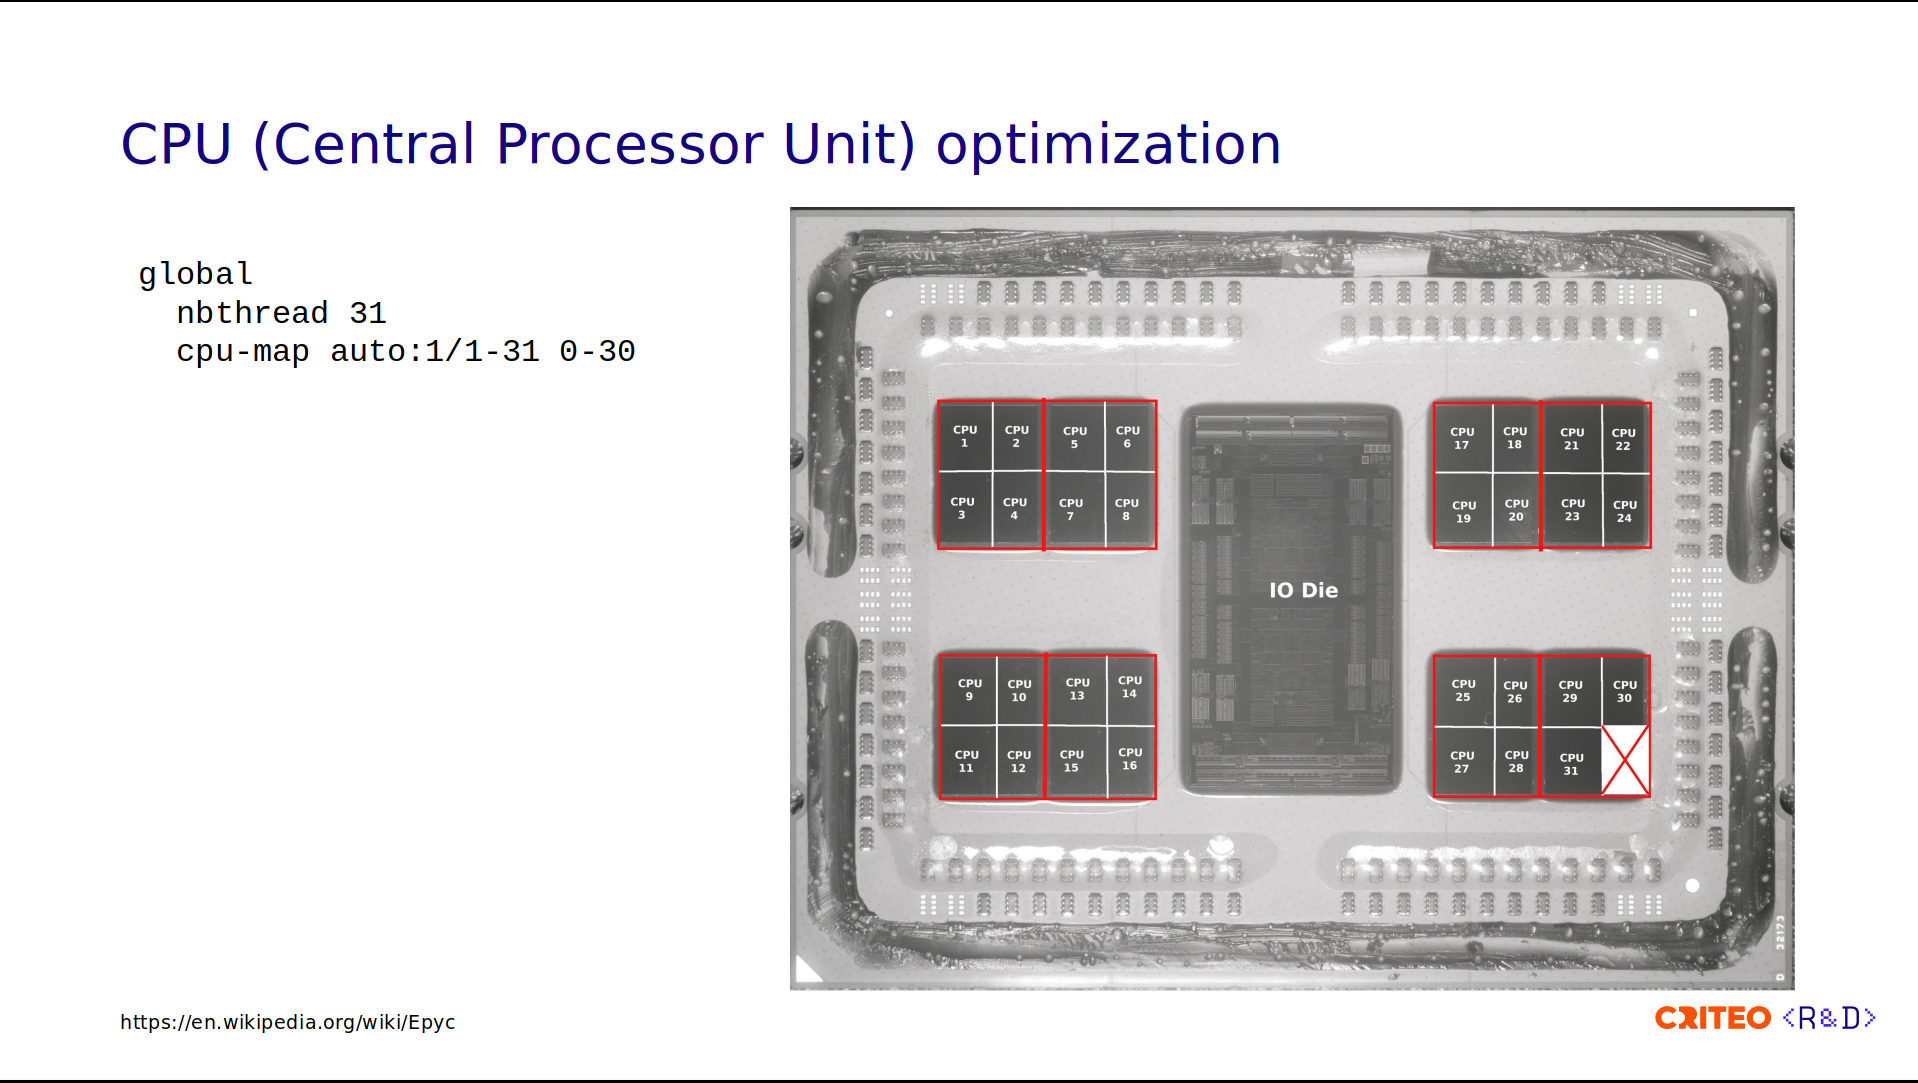
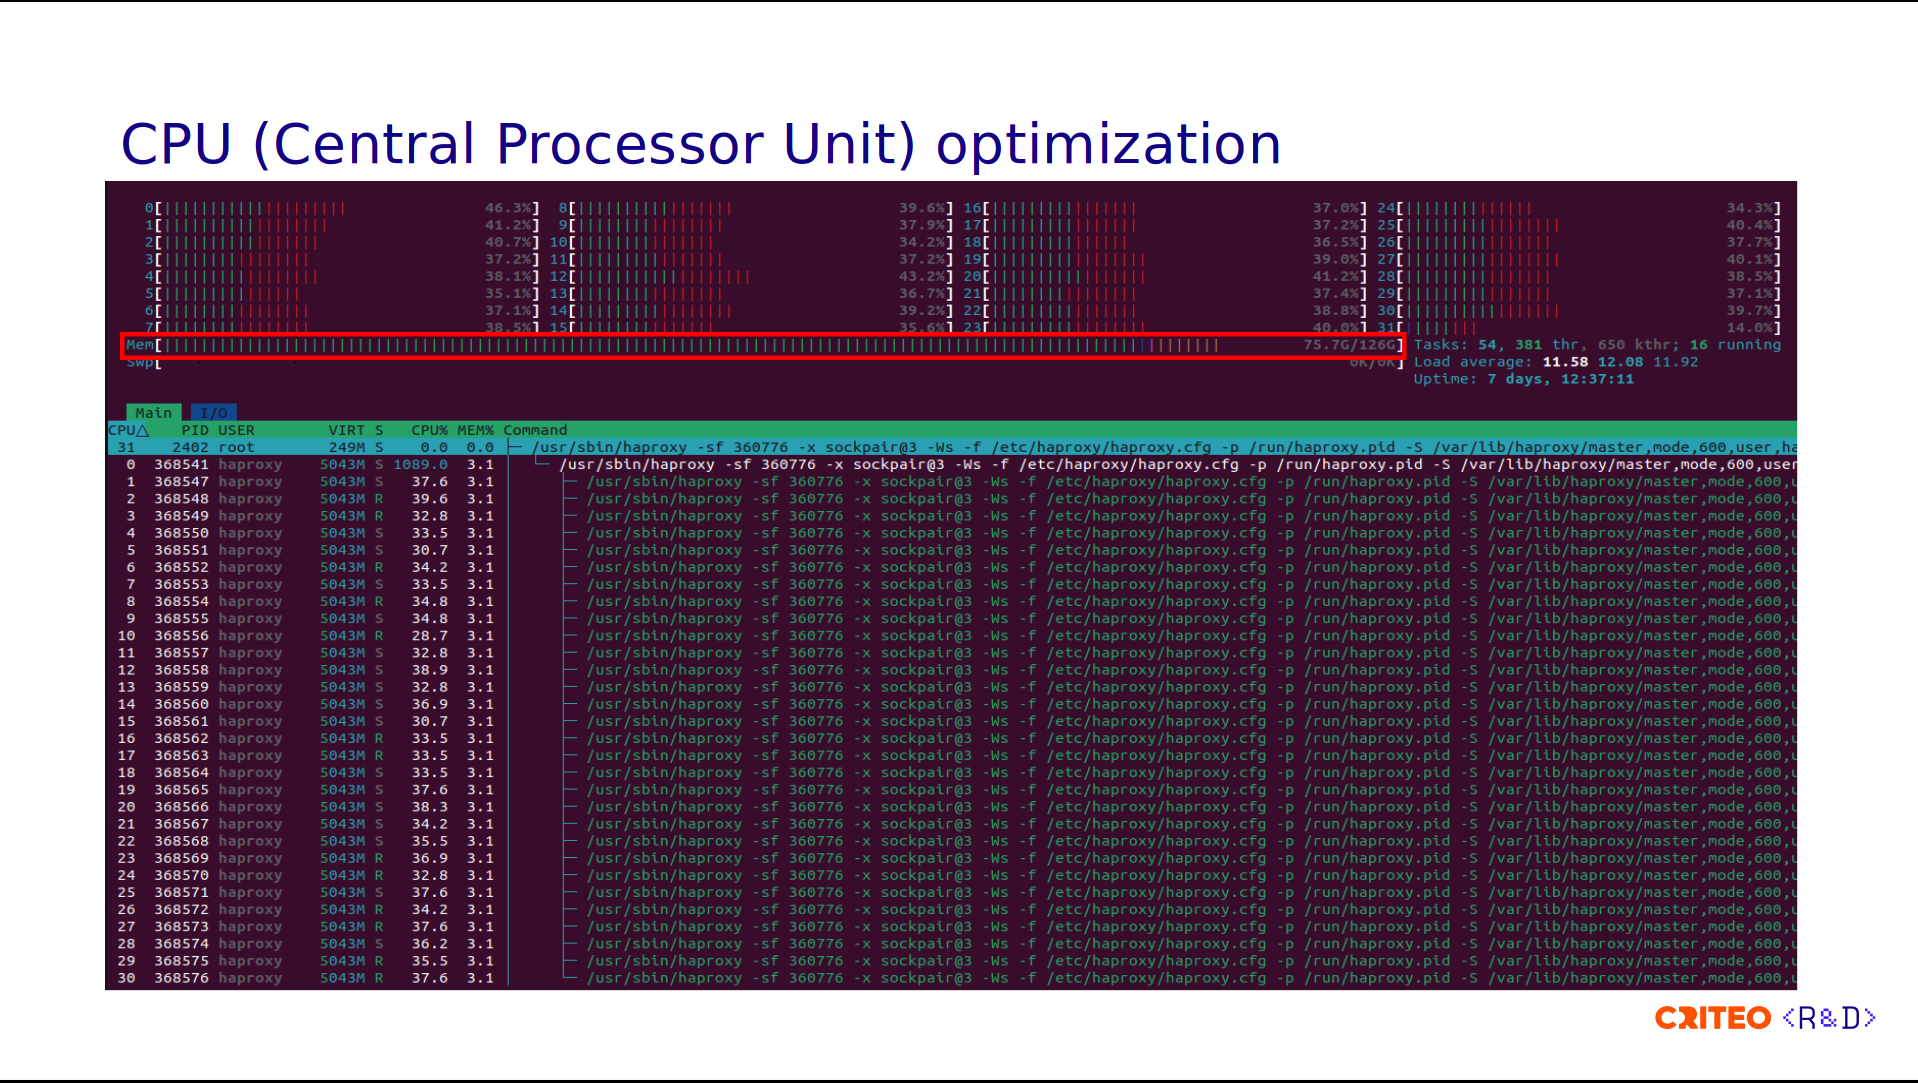
Our current configuration is very simple. We allocate 31 threads and assign one thread per core. Since our intention is to avoid thread starvation, attributing one CPU per thread is acceptable.
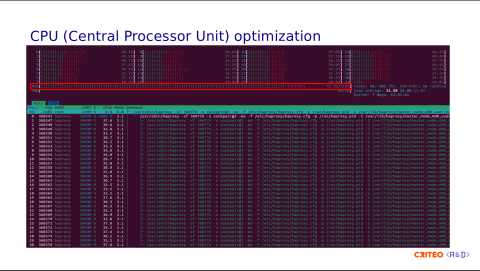
Here is a capture of the htop command when run on one of our servers. You can see that each thread is attached to one CPU core, and the last CPU, CPU 31 (since the index starts from 0), runs the Control Plane (run under systemd). If you remember the architecture diagram I showed you earlier, we have a Varnish instance installed on the same server as HAProxy which explains the RAM usage.
With all of this in mind, our aim is always to get the best use of the system resources. Therefore, we started to test a recent feature introduced in HAProxy. In HAProxy 3.2, which was released last week, there are some options to control the CPU allocation policy automatically.
Here we have the following:
global
  cpu-set drop-cpu 31
  cpu-policy group-by-2-clusters
We drop-cpu 31 and we group-by-2-clusters. This is equivalent to the following configuration:
global
  thread-groups 4
  cpu-map auto:1/1-8 0-7
  cpu-map auto:2/1-8 8-15
  cpu-map auto:3/1-8 16-23
  cpu-map auto:4/1-7 24-30
You can use it in versions earlier than 3.2.
This may seem kind of complex, but if you look at the image, this corresponds to thread groups 1, 2, 3, and 4 in blue, one for each CCD. In total, we have four thread groups. Each one has 8 cores except the last one, which has 7.
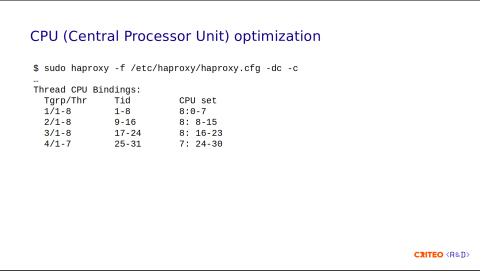
There is a command-line option to display the thread bindings from the configuration. This helps you to get an idea of the configuration that will be applied at runtime.
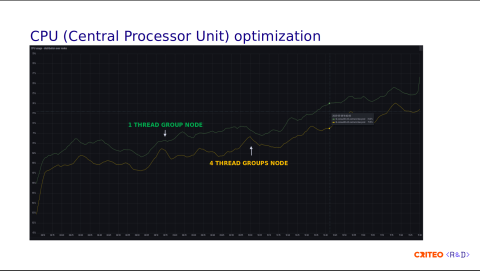
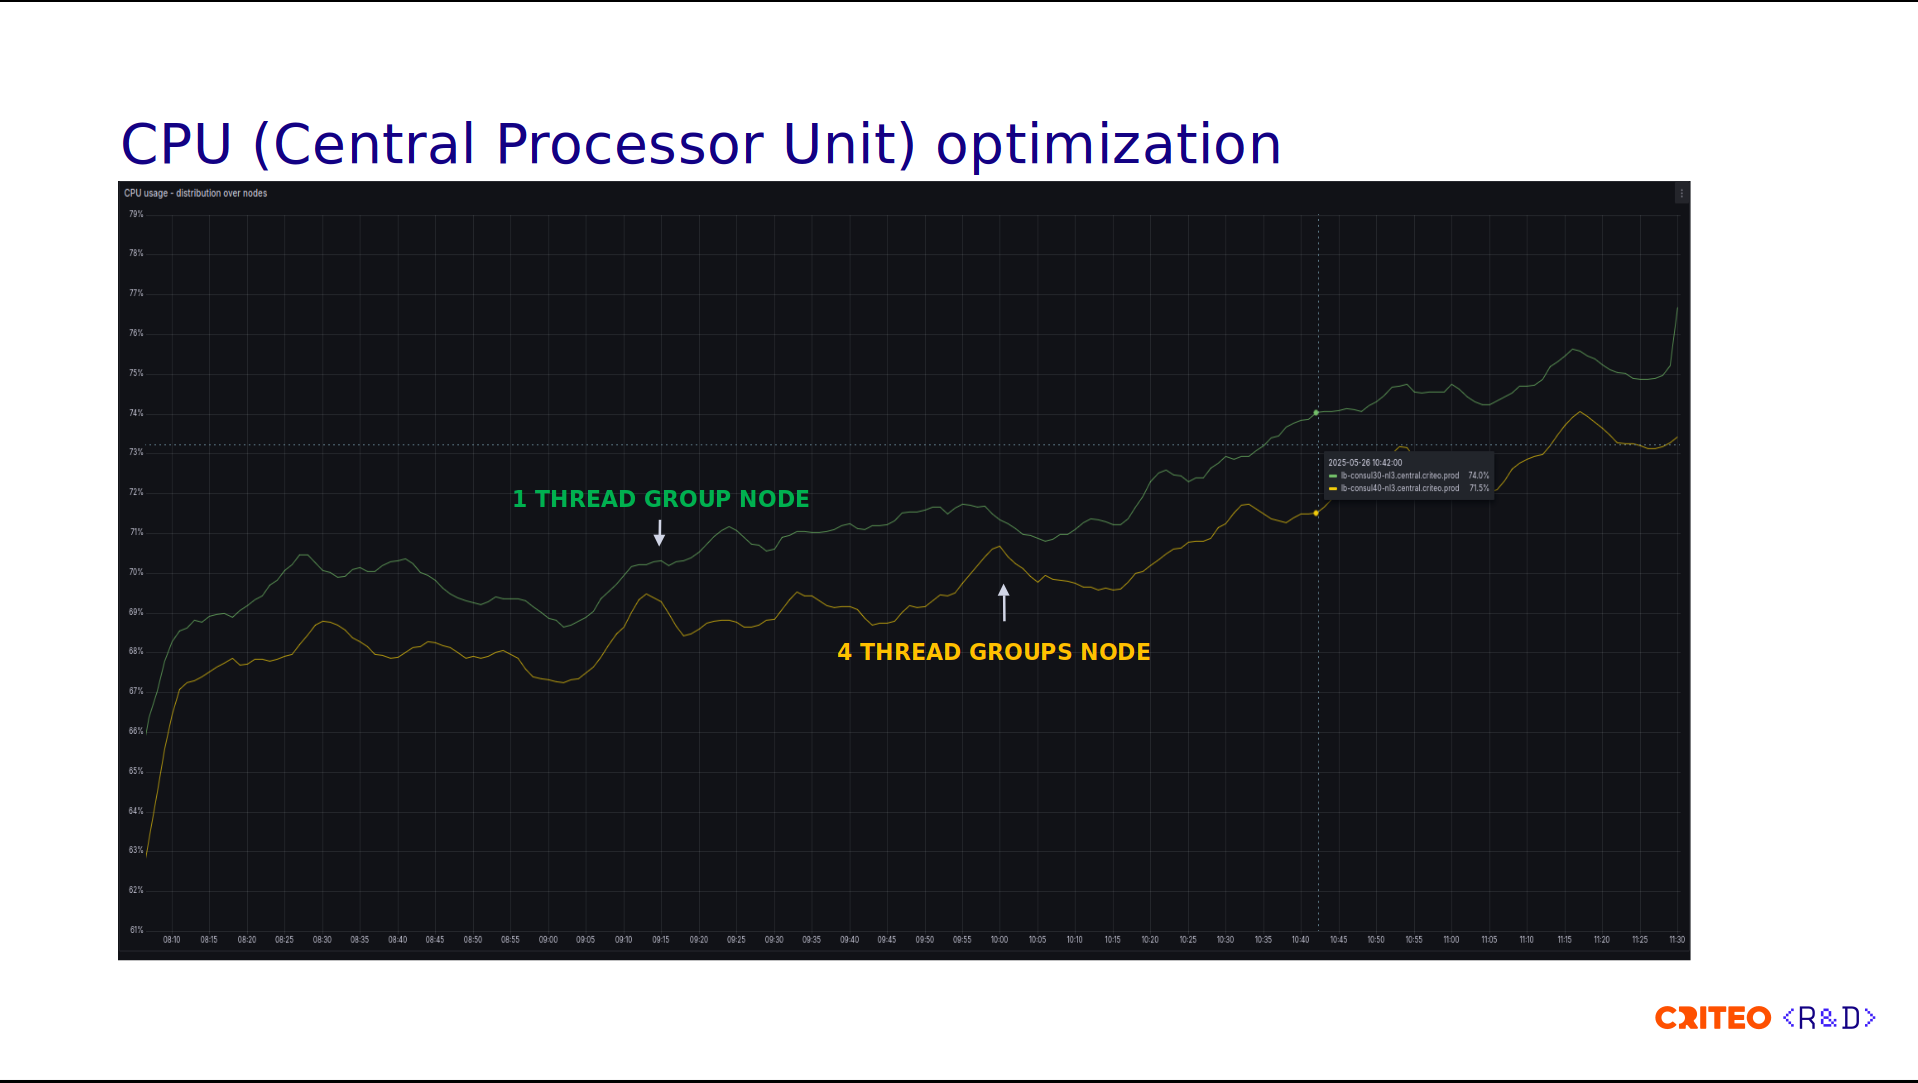
We applied the exact same load to the reference node with the normal configuration, which is one thread per core. Using equivalent traffic, we observed that the node with four thread groups used less CPU. This is not a lot, but there is a lot of room for potential improvement and optimization.
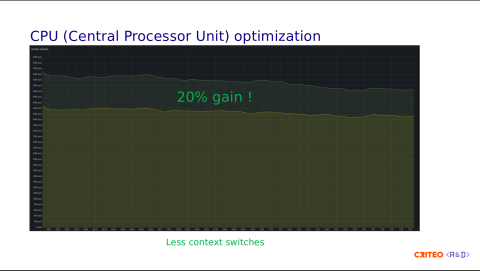
Looking at the context switching, we observed a gain of 20% which the CPU grouping by CCD clearly explains since operations don't have to cross the I/O die.

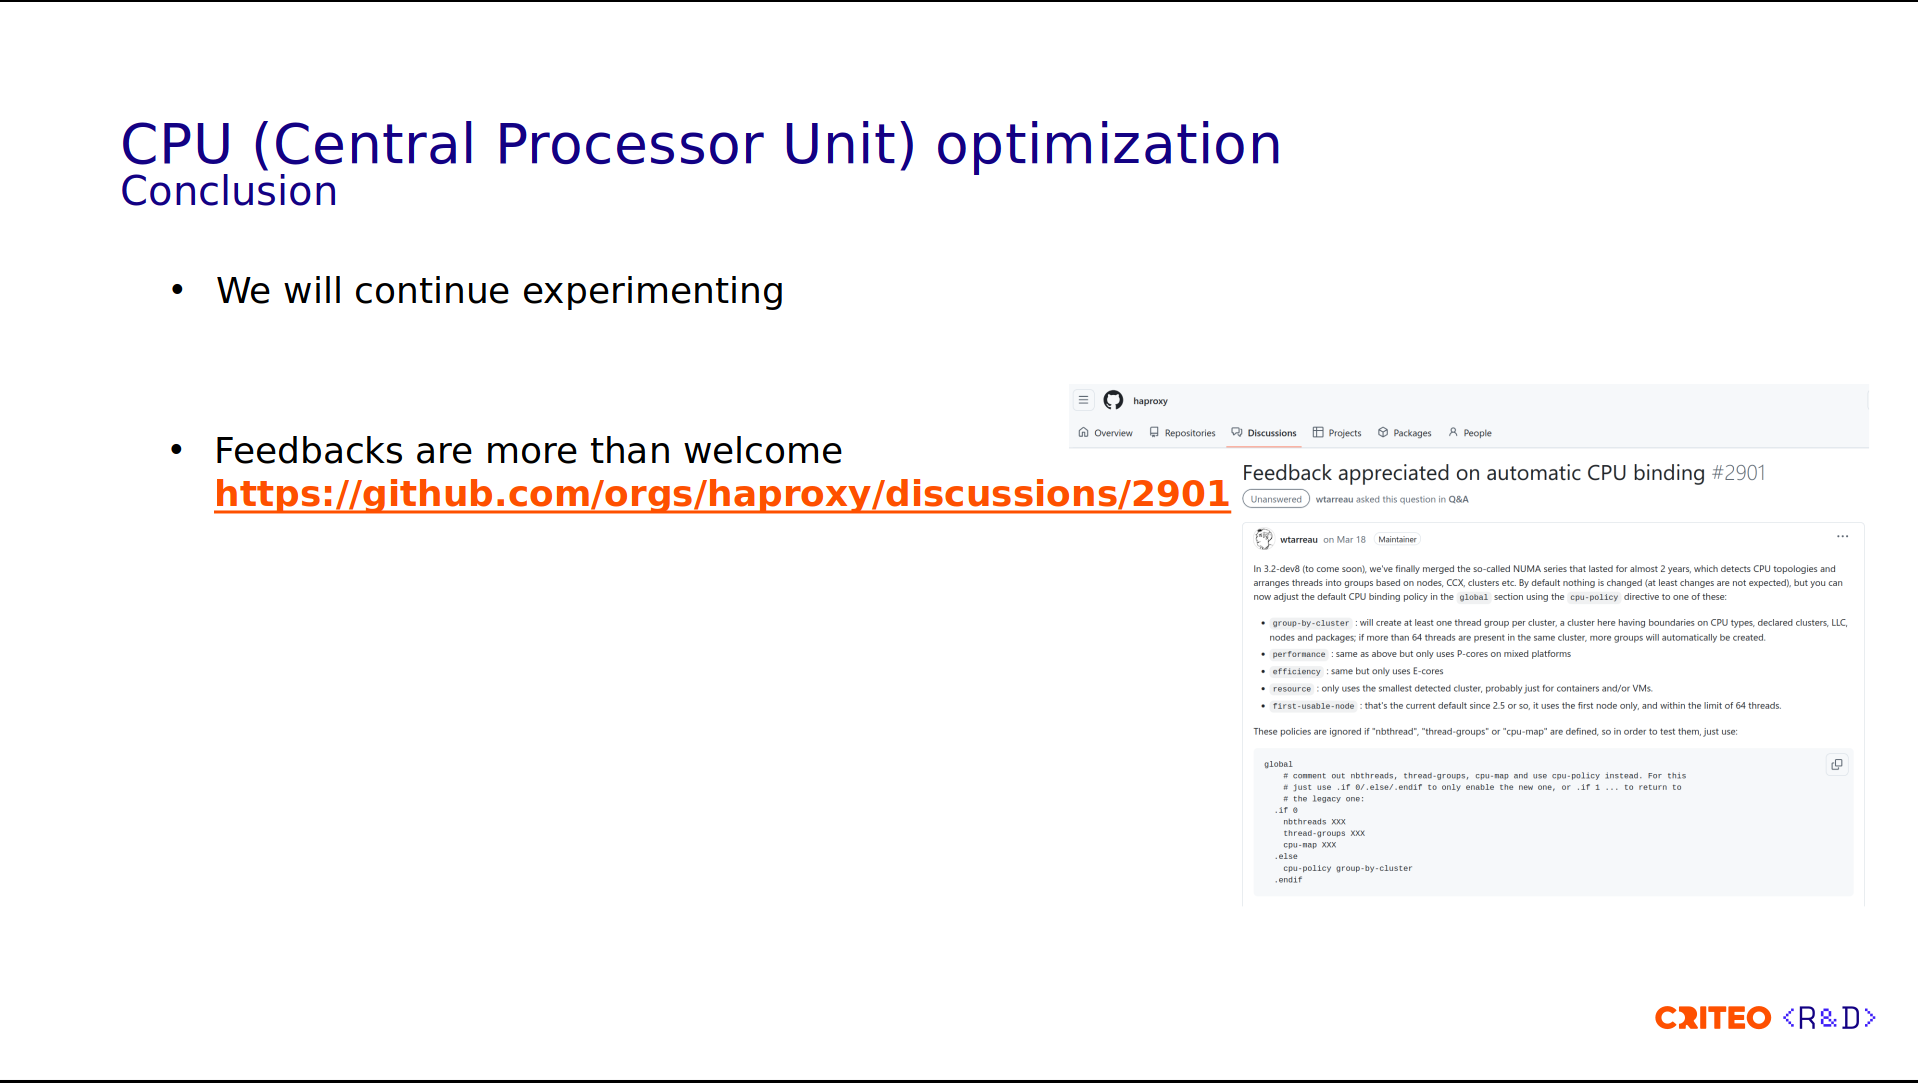
In conclusion, we will continue experimenting to determine the best configuration that works for us. Clearly, having an auto-computed cpu-policy abstracts a lot of the complexity, so I invite you to try it. There is an open discussion on github to gather feedback in case you want to try it.
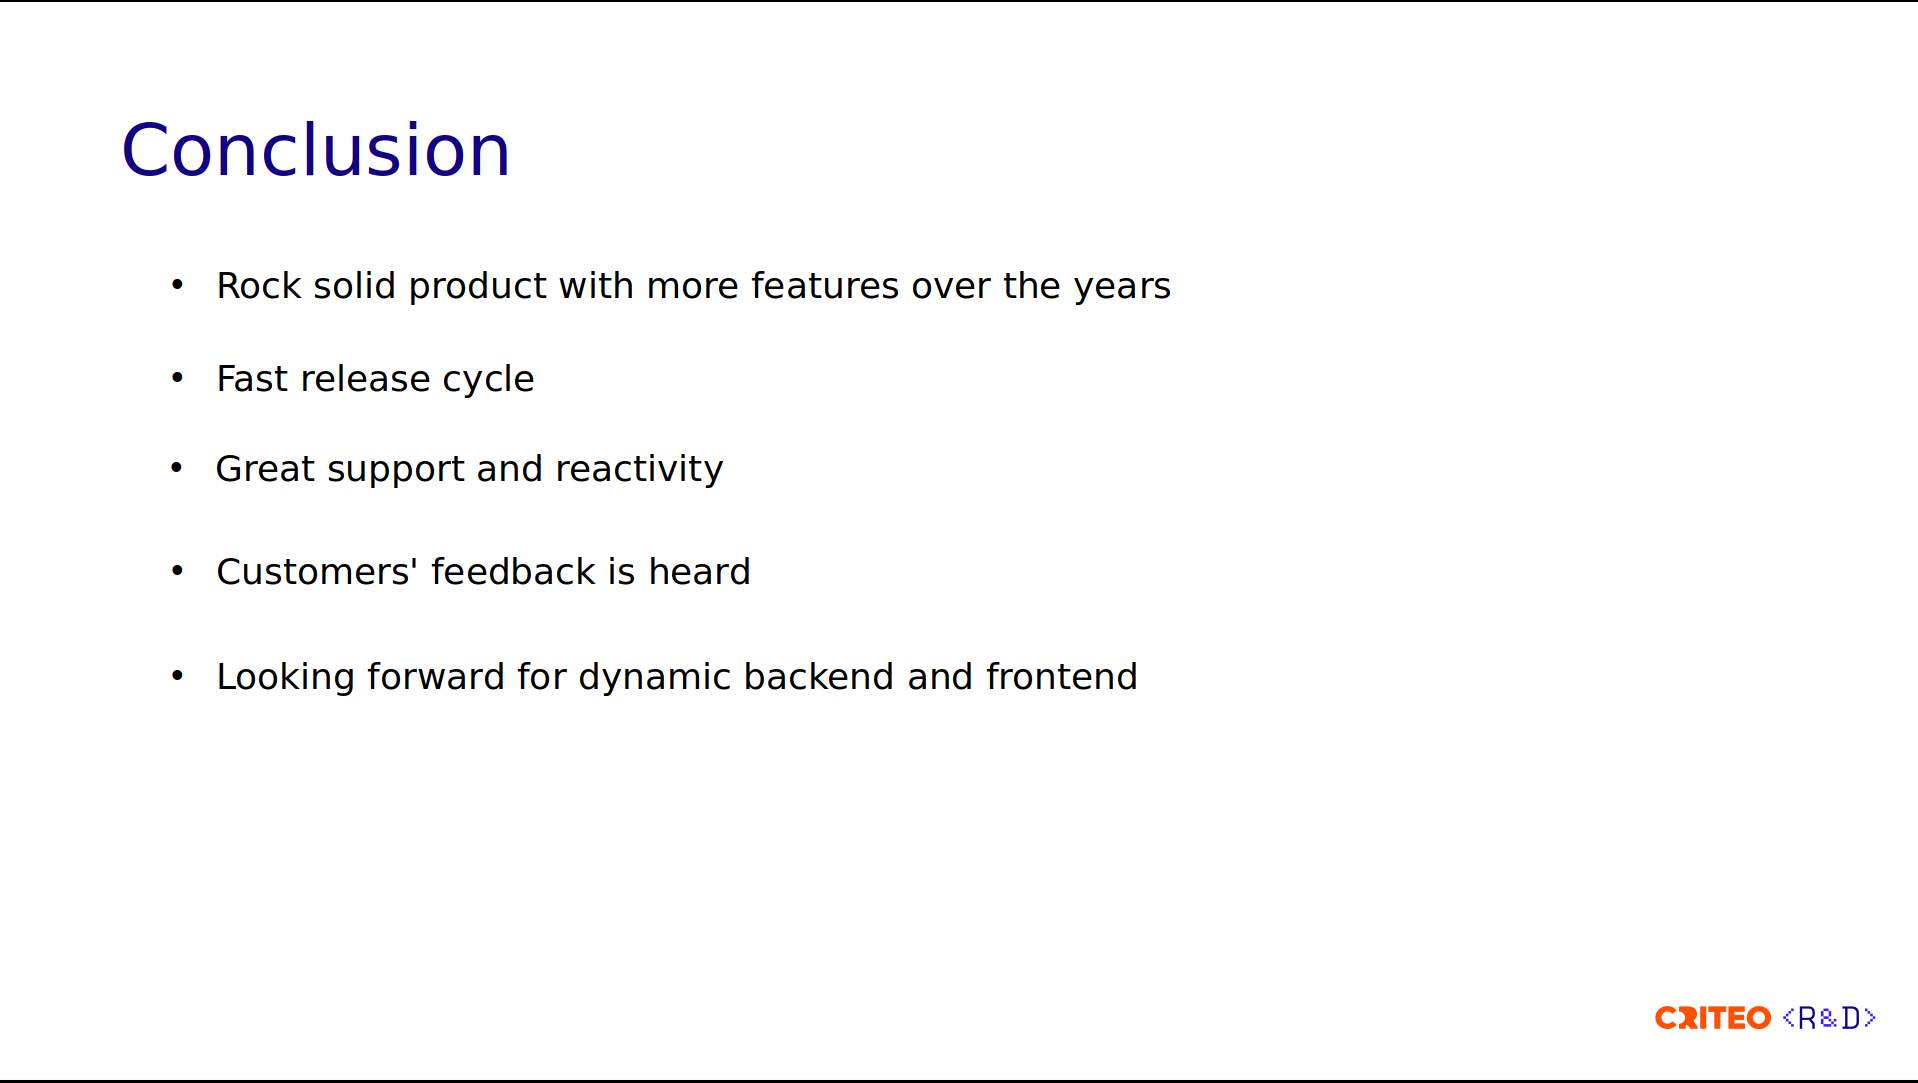
To conclude this talk, we're very happy with all the features HAProxy provides, and we very much appreciate the release cycle of HAProxy, which is quite fast. There are always many improvements and bug fixes. On my team, we tend to install the latest version as soon as it is released to give early feedback and experiment with new features. As I explained during this talk, the HAProxy team reacts quickly to bug fixes, and sometimes we can see a bug fixed on the same day. During the last year we've developed a very close relationship with the HAProxy team.
The last point I would like to add is that we are looking forward to having dynamic backends and frontends to perform automation at all levels.
Thank you for your attention, and if you have any questions, feel free to ask.