
HAProxy publishes more than 100 metrics about the traffic flowing through it. When you use HAProxy as an API gateway, these give you insight into how clients are accessing your APIs. Several metrics come to mind as particularly useful, since they can help you determine whether you’re meeting your service-level objectives and can detect issues with your services early on. Let’s discuss several that might come in handy.
Using HAProxy as an API Gateway, Part 1 [Introduction]
Using HAProxy as an API Gateway, Part 2 [Authentication]
Using HAProxy as an API Gateway, Part 3 [Health Checks]
Using HAProxy as an API gateway, part 4 [metrics]
Using HAProxy as an API Gateway, Part 5 [Monetization]
Using HAProxy as an API Gateway, Part 6 [Security]
Important API metrics
Are your API servers up? Keeping an eye on server health status is critical for knowing how many servers are passing the health-check probes that HAProxy sends. HAProxy publishes the up/down status of every server along with the pass/fail result of the most recent health check. You could use this to know when more than 25% of your servers are down, for example.
How often are clients calling your API’s functions? HAProxy records the request rate, which is great for seeing usage trends. Knowing which services and functions are the most popular could help when deciding where to add new features or increase server capacity. Use it to reveal unusual traffic patterns too, such as malicious activity like DDoS attacks and faulty client-side code that may be invoking a function repeatedly. HAProxy can enforce rate limits to protect your servers. Detecting client-side code that’s gone haywire might be important if you sell access to your APIs and tie the price to the number of calls a client makes.
Another important metric is the number of errors. When a response from a server travels back through HAProxy on its way to the client, we get its status code. For example, statuses in the 400-499 range indicate client-side errors and those in the 500-599 range indicate server-side errors. A relatively small number of client-side errors may indicate only a single misconfigured client, but a sharp increase may be cause for concern. It may be due to a client intentionally trying to abuse your service. Server-side errors generally trace back to bugs introduced during the last deployment.
Also keep an eye on average response time, since it shows how snappy your APIs seem to clients. A slowdown may be related to a slow database query or a sudden surge of requests overwhelming your servers. Of course, HAProxy can queue requests before they reach your servers so that your servers always operate within the ideal range of traffic volume.
A final counter to monitor closely is the number of retries. HAProxy has the ability to retry a failed connection or HTTP request. It can retry with the same server or, if the redispatch option is set, retry with a different server. If the second, third, or even subsequent try succeeds you won’t see an error status in your HAProxy metrics, but you will see your number of retries increase. A large number of retries might implicate your network as the culprit.
How HAProxy publishes metrics
As HAProxy has evolved, it has included more and more ways to extract its metrics. If you’re looking for a quick way to see current numbers, enable the built-in HAProxy Stats page. There you’ll find more than 100 unique metrics. Although it doesn’t store historical data, it’s convenient for checking server health, current request rate, error rate, and more without any other monitoring software.
Enable the Stats page by adding this frontend section to your HAProxy configuration file:
| frontend stats | |
| bind :8404 | |
| stats enable | |
| stats uri / | |
| stats refresh 10s |
The dashboard then runs on port 8404:
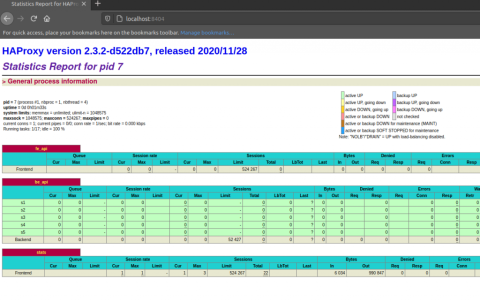
Learn about the fields shown on the Stats page in our blog post Exploring the HAProxy Stats Page.
You can also fetch the same metrics in a more programmatic way by using the HAProxy Runtime API. First, enable the API by adding a stats socket directive to the global section of your configuration. This exposes the API as a Unix socket located at /var/run/haproxy.sock so you can call it from scripts and programs running on the same machine:
| global | |
| stats socket /var/run/haproxy.sock user haproxy group haproxy mode 660 level admin |
You can also publish it on an IP address and port of your choosing so that you can access it remotely. In the following example, the API listens at localhost on port 9999:
| global | |
| stats socket ipv4@127.0.0.1:9999 user haproxy group haproxy mode 660 level admin |
Assuming you’re using the IP address, send the show stat command to the API by using the socat program. You’ll get the metrics in CSV format by default, but you can change this to JSON by passing the json parameter. Piping the JSON results to Python’s json.tool program formats the output in a human-readable way.
| $ echo "show stat json" | socat tcp-connect:127.0.0.1:9999 - | python3 -m json.tool |
You can also pipe the results to the cut and column commands to display only the data you want to see. Here, we get the up/down status, request rate, number of errors, average response time and number of retries for the servers listed in a backend named be_api. The watch command updates the numbers every two seconds:
| $ watch 'echo "show stat" | socat tcp-connect:127.0.0.1:9999 - | cut -d "," -f 1-2,16,18,43,44,47,61 | column -s, -t' | |
| # pxname svname wretr status hrsp_4xx hrsp_5xx req_rate rtime | |
| fe_api FRONTEND OPEN 0 0 10 | |
| be_api s1 0 UP 0 0 4 | |
| be_api s2 0 UP 0 0 4 | |
| be_api s3 0 UP 0 0 5 | |
| be_api s4 0 UP 0 0 5 | |
| be_api s5 0 UP 0 0 5 | |
| be_api BACKEND 0 UP 0 0 4 |
A third way to fetch metrics from HAProxy is through its integrated Prometheus exporter. Prometheus is an open-source tool for collecting and storing time-series data. Applications that want to publish Prometheus metrics host a webpage, usually at the URL /metrics, that a Prometheus server will scrape at an interval. You’ll see how to set this up in the next section.
If you use HAProxy Enterprise, you have access to the Send Metrics module too. This module allows you to define a custom format for your metrics and then stream them to any URL that you choose. This makes it possible to integrate HAProxy Enterprise with nearly any observability platform.
Visualizing the metrics
When it comes to visualizing HAProxy’s metrics over time, there are many options—both free and commercial. To get you started, I’ll demonstrate how to set up two open-source graphing tools: Grafana from Grafana Labs and Kibana from Elastic.
There are already integrations that link HAProxy’s metrics with Grafana or Kibana, so you won’t need to build your own. You only need to set up your chosen software, install the plugin, and start using your data. Let’s go over the steps for both options.
Grafana
Grafana is a popular choice for building graphs and dashboards and it supports Prometheus as a data source. So, you can leverage HAProxy’s Prometheus feature. It works like this: HAProxy publishes its metrics at a known URL, /metrics. A Prometheus server scrapes this page every five seconds and stores the metrics over the long term, which allows you to calculate historical trends. Grafana fetches the data from the Prometheus server to display graphs.
In this tutorial, we will use the prebaked HAProxy dashboard from Ricardo F.’s grafana-dashboards code repository.
Follow the Prometheus installation instructions to set up the Prometheus server that will store your metrics.
Check that the Prometheus exporter has been compiled into your version of HAProxy. If not, you’ll need to compile it in. Check by passing the -vv flag to HAProxy:
| $ haproxy -vv | grep "Prometheus exporter" | |
| Built with the Prometheus exporter as a service |
Add a frontend to your HAProxy configuration that listens on port 8404. This serves two purposes. It enables the HAProxy Stats page and also the Prometheus metrics web page. Configure it as shown below:
| frontend stats | |
| bind :8404 | |
| stats enable | |
| stats uri / | |
| stats refresh 5s | |
| http-request use-service prometheus-exporter if { path /metrics } |
On your Prometheus server, edit the file /etc/prometheus/prometheus.yml so that it includes your HAProxy server in the list of targets that it scrapes. Then restart the service. Here’s how the file should look:
| global: | |
| scrape_interval: 5s | |
| evaluation_interval: 5s | |
| scrape_configs: | |
| - job_name: 'haproxy' | |
| static_configs: | |
| - targets: ['172.25.0.11:8404'] |
Follow the Grafana installation instructions to set up a Grafana server. Once up and running, log in at port 3000 using the username and password admin / admin.
Under the Configuration tab, add a new Prometheus Data Source. Set the URL to your Prometheus server. Then save it.
Download Ricardo F.’s HAProxy Dashboard JSON file from GitHub, which is a prebaked dashboard with graphs for the HAProxy metrics.
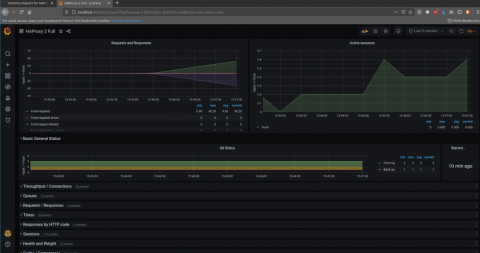
Go to the Dashboard > Import screen and paste the JSON into the textbox. Then click Load
The imported dashboard displays many graphs, including those that show the metrics that we discussed earlier as being important for monitoring APIs.
Kibana
Kibana is the dashboard component of the Elastic Stack, a popular suite of tools for indexing and examining logs and metrics. To use it, we’ll push HAProxy’s metrics to an Elasticsearch database and then have Kibana display them.
We will use Metricbeat to ship HAProxy’s metrics to Elasticsearch. Metricbeat’s HAProxy module uses the Runtime API behind the scenes. Here’s how to set it up:
Enable the HAProxy Runtime API by adding the stats socket directive to the global section of your configuration. In the example below, it listens on port 9999:
| global | |
| stats socket ipv4@*:9999 user haproxy group haproxy mode 660 level admin |
Deploy an Elasticsearch server. This is the database that will hold your metrics data over the long term.
Deploy Kibana on a server.
On your HAProxy server, install Metricbeat.
Enable the HAProxy Metricbeat module with the following command:
| $ metricbeat modules enable haproxy |
Edit the file /etc/metricbeat/metricbeat.yml so that it lists your Elasticsearch server under the output.elasticsearch section:
| output.elasticsearch: | |
| hosts: ["172.25.0.19:9200"] |
Edit the file /etc/metricbeat/modules.d/haproxy.yml to configure the HAProxy module so that the hosts field includes the address and port where your HAProxy Runtime API is listening:
| - module: haproxy | |
| metricsets: ["info", "stat"] | |
| period: 10s | |
| hosts: ["tcp://172.25.0.11:9999"] | |
| enabled: true |
Start the Metricbeat service to begin shipping HAProxy metrics to Elasticsearch:
| $ sudo service metricbeat start |
Open Kabana in your browser. It listens at port 5601. Go to Kibana > Dashboard and click to Create index pattern. Set the index pattern to metricbeat-*.
On the next screen, set the Time field to @timestamp. You should now see HAProxy metrics when you search for them.
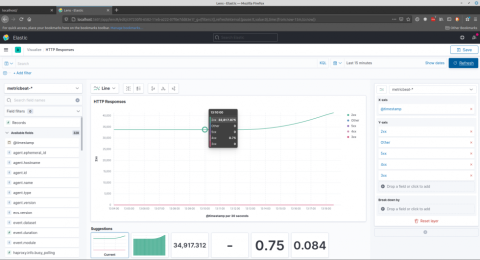
Go to Kibana > Visualize and create a new visualization. Try the Lens dashboard, which offers an intuitive way to create graphs from your metrics. You can search for metrics that begin with haproxy and then drag them onto the visualization canvas.
In the screenshot below, I have dragged the haproxy.stat.response.http.2xx, 3xx, 4xx, and 5xx metrics onto the visualization.
Conclusion
HAProxy provides many metrics that are essential when proxying API traffic. A few that you should consider are server health status, request rate, number of errors, average response time, and number of retries. This data can be extracted from HAProxy either through its Runtime API or the built-in Prometheus exporter. There are already integrations available for popular, open-source graphing tools such as Grafana and Kibana. With minimal setup, you can begin observing trends in your data.
Want to stay up to date on similar topics? Subscribe to this blog! You can also follow us on Twitter and join the conversation on Slack.
Interested in advanced security and administrative features? HAProxy Enterprise is the world’s fastest and most widely used software load balancer. It powers modern application delivery at any scale and in any environment, providing the utmost performance, observability, and security. Organizations harness its cutting edge features and enterprise suite of add-ons, backed by authoritative expert support and professional services. Ready to learn more? Sign up for a free trial.
Subscribe to our blog. Get the latest release updates, tutorials, and deep-dives from HAProxy experts.
![Using HAProxy as an API Gateway, Part 5 [Monetization]](https://cdn.haproxy.com/img/containers/partner_integrations/api-gateway-monetization.png/f6ba7bc74399bb3dbeaec96f2813c2f7/api-gateway-monetization.png)
![Using HAProxy as an API Gateway, Part 6 [Security]](https://cdn.haproxy.com/img/containers/partner_integrations/api-gateway-security.png/809caaf409b9cbba5f53d22b31c00307/api-gateway-security.png)
![Using HAProxy as an API gateway, part 1 [introduction]](https://cdn.haproxy.com/img/containers/partner_integrations/2022/api-gateway-pt1/avalanche-area-1080x540.png/2b915c11c726470bf6e314e194c3a7ed/avalanche-area-1080x540.png)
![Using HAProxy as an API Gateway, Part 2 [Authentication]](https://cdn.haproxy.com/img/containers/partner_integrations/image2-e1548174430466.png/3942e9fa498bb46e325ba72db6f9bd84/image2-e1548174430466.png)