
HAProxy and HAProxy Enterprise have added native support for Prometheus, allowing you to export metrics directly.
Metrics are a key aspect of observability, along with logging and tracing. They contain the data that inform you about the state of your systems, which in turn allows you to see patterns and make course corrections as needed. Metrics give you essential feedback about how well, or unwell, things are going: Are customers using the new features? Did traffic rates drop after that last deployment? If there’s an error, how long has it been happening, and how many customers have likely been affected?
HAProxy currently provides exceptional visibility through its Stats page, which displays more than 100 metrics. It can be consumed as a CSV-formatted feed—although you can also use the Runtime API to export the data as JSON. CSV is perhaps one of the easiest formats to parse and, as an effect, many monitoring tools utilize the Stats page to get near-real-time statistics from HAProxy. In particular, many users have benefited from the HAProxy Exporter for Prometheus, which consumes the HAProxy Stats page and converts the data to the Prometheus time series.
HAProxy Fusion provides full-lifecycle management, monitoring, and automation of multi-cluster, multi-cloud, and multi-team HAProxy Enterprise deployments. HAProxy Fusion combines a high-performance control plane with a modern GUI and API (with 100% coverage), enterprise administration, and a comprehensive observability suite including customizable dashboards, traffic map views, a granular Request Explorer, and rich log collection.
Both products are core components of HAProxy One: the world's fastest application delivery and security platform that is the G2 category leader in API management, container networking, DDoS protection, web application firewall (WAF), and load balancing.
Starting in version 2.0, you can compile HAProxy with native Prometheus support and expose a built-in Prometheus endpoint. The new module can be found in the HAProxy source code, under the contrib directory. HAProxy Enterprise users can begin using this feature today as it has been backported to version 1.9r1. Having Prometheus support built-in means that you don’t need to run an extra exporter process. Enable the service in your HAProxy configuration file and you’ll be all set.
In this blog post, we’ll explain how to set up the metrics endpoint, how to configure Prometheus to scrape it and offer some guidance on graphing the data and alerting on it.
The Prometheus Metrics Page
With traffic flowing through HAProxy, it becomes a goldmine of information regarding everything from request rates and response times to cache hit ratios and server errors. Graphing these statistics will help you identify when and where issues are happening and alerting will ensure that you’re notified when issues arise. Having this information on hand might even help you quickly resolve that complaint at 2:27 a.m.!
Prometheus is especially helpful because it collects the metrics, stores them in its time-series database, and allows you to select and aggregate the data using its PromQL query language. It also integrates nicely with graphing tools like Grafana and the alerting tool Alertmanager.
The new HAProxy Prometheus exporter exposes all of the counters and gauges available from the Stats page. In fact, it exposes more than 150 unique metrics. However, the data is extracted directly from the running HAProxy process.
Compiling HAProxy for Prometheus
First, you’ll need to compile HAProxy with the Prometheus Exporter. You’ll find instructions in the README. The commands look like this on an Ubuntu server:
| sudo apt update | |
| sudo apt install -y git ca-certificates gcc libc6-dev liblua5.3-dev libpcre3-dev libssl-dev libsystemd-dev make wget zlib1g-dev | |
| git clone https://github.com/haproxy/haproxy.git | |
| cd haproxy | |
| make TARGET=linux-glibc USE_LUA=1 USE_OPENSSL=1 USE_PCRE=1 USE_ZLIB=1 USE_SYSTEMD=1 USE_PROMEX=1 | |
| sudo make install-bin |
Note that when cloning from the git repository, you’re using the latest, cutting-edge code. If you previously installed HAProxy using your system’s package manager, execute these commands as well:
| sudo systemctl stop haproxy | |
| sudo cp /usr/local/sbin/haproxy /usr/sbin/haproxy | |
| sudo systemctl start haproxy |
Afterward, verify that the Prometheus Exporter has been included in the compiled executable:
| haproxy -vv | |
| Built with the Prometheus exporter as a service |
Now you’re good to go. You can begin serving a dedicated page that exposes metrics for Prometheus to scrape. In the next section, we’ll show how to configure HAProxy to do that.
Configuring HAProxy
Since you can route requests depending on an if statement, it’s convenient to combine the Stats page and the Prometheus endpoint into one frontend section. If you’re new to using conditional statements in HAProxy, read our blog post Introduction to HAProxy ACLs. Add the following to your HAProxy configuration file:
| frontend stats | |
| bind *:8404 | |
| option http-use-htx | |
| http-request use-service prometheus-exporter if { path /metrics } | |
| stats enable | |
| stats uri /stats | |
| stats refresh 10s |
You must enable the new native HTTP representation (HTX) mode by adding option http-use-htx. Then, the http-request use-service line intercepts any requests for /metrics and directs them to the exporter. The exporter can reside under any path, but /metrics is the path Prometheus expects.
If you visit http://localhost:8404/metrics, you will see a list of the metrics provided.
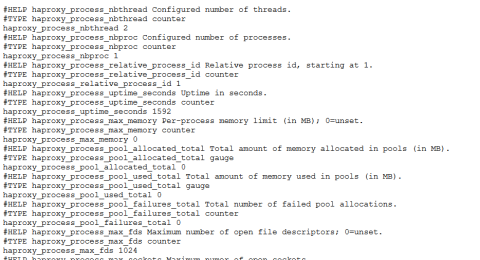
HAProxy exposes Prometheus-style metrics
You can also visit /stats to see the HAProxy Stats page. Next, we’ll start Prometheus scraping the HAProxy metrics.
Configuring Prometheus
To get started with Prometheus, follow the First Steps with Prometheus guide to getting up and running. This tells you how to run Prometheus as a standalone executable. The documentation also explains how to run it as a Docker container and how to install it using a configuration management tool. Once you have it, edit your prometheus.yml file so that it contains a job for HAProxy by adding the following to the scrape_configs section:
| - job_name: 'haproxy' | |
| static_configs: | |
| - targets: ['localhost:8404'] |
By default, Prometheus scrapes the path /metrics and since that is what we configured in HAProxy, nothing further needs to be changed. For this example, I’m running only a single instance of HAProxy, which is running on the same server as Prometheus. If you’re operating a cluster of load balancers, then each HAProxy server should have its own targets line. Or, you can use one of the service discovery systems that Prometheus supports to have HAProxy servers added and removed dynamically.
The Prometheus expression browser listens on port 9090. Visit it by going to the Graph tab and entering the following query into the Expression field:
| haproxy_frontend_http_requests_rate_current |
Then click Execute. You should see a graph showing request rates for each of your frontends. It will look like this:
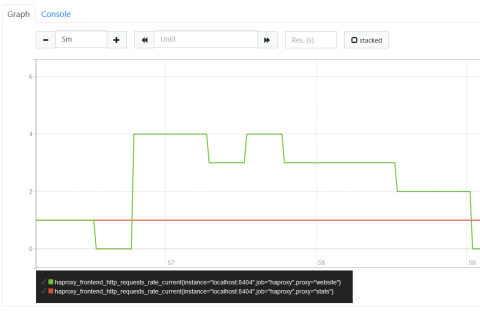
Visualizing using the Prometheus expression browser
If you don’t see the graph, click the Status menu entry at the top of the page and select Targets. There you should see haproxy as one of the endpoints and its state should be up.
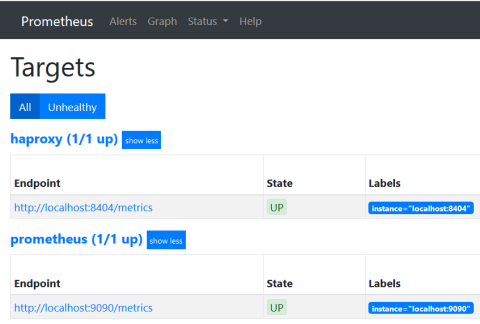
Checking if the HAProxy target is up
Adding Graphs with Grafana
The Prometheus expression browser is good for experimenting with PromQL and quickly checking the results, but you can get more robust graphs by connecting your time-series data to Grafana. Grafana supports using Prometheus as a data source and has a number of helpful features such as the ability to create tailor-made dashboards. In this post, I’ll be using Grafana v6.1.3.
The first step is to set up a Grafana instance by following the installation guide. Next, log into Grafana, which listens on port 3000. Its default login credentials are admin / admin. Once in, click the Add data source link and choose Prometheus from the list of supported data source types.
When configuring the data source, set the URL to where your Prometheus database is running, such as http://localhost:9090. Set Access to Server and then click Save & Test to finish setting up the data source.
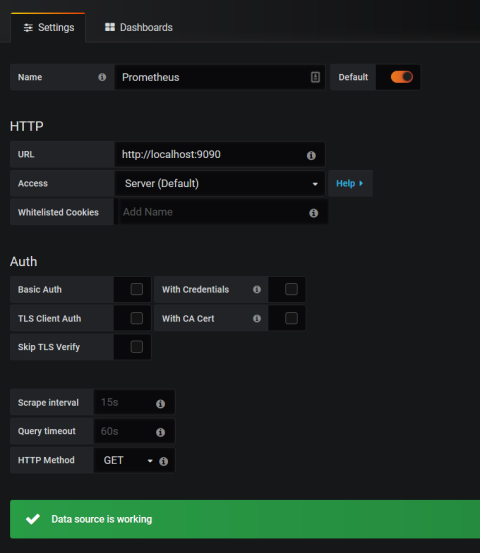
Adding a Grafana data source
You’re now ready to create some graphs. Add a new dashboard, choose the Add Query option, and enter the following PromQL query (swapping fe_main for the name of your frontend). The steps may be slightly different if you’re using a different version of Grafana.
| sum(haproxy_frontend_http_requests_rate_current{proxy="fe_main",job="haproxy"}) |
Click the refresh button at the top of the dashboard and, given your website has received some traffic, you should see some data displayed.
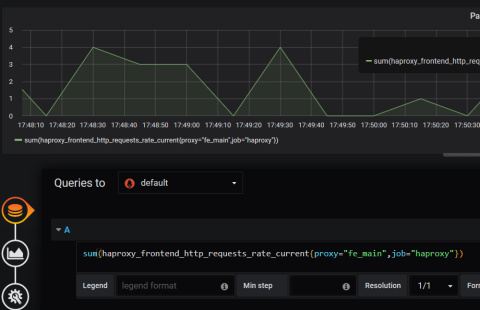
Graphing HAProxy data in Grafana
Since we’re using the sum method to aggregate data across all instances of HAProxy listed under the haproxy job, you should see a line graph depicting request rates over the selected time period. You can save this graph to a dashboard where it can be displayed alongside other graphs.
As the queries you use in Grafana are actually Prometheus queries, you can learn how to get the most out of them by reading the Querying Prometheus guide. There are also a number of pre-built dashboards available from the Grafana site, although, as most of them use the Prometheus Exporter project’s field names, they’ll need to be adjusted to work with the built-in exporter.
Alerting with Alertmanager
Now that you have graphing up and running, you can configure alerts that use the same data source. Prometheus manages the alert rules and then sends the resulting notifications to an external daemon. We’ll cover using Alertmanager.
First, configure rules in Prometheus for the conditions you’d like to get notifications about. To do this, you will add a rules_file section to your prometheus.yml file, which lists files that contain rules for generating alerts.
| rule_files: | |
| - 'alerts.yml' |
While you’re at it, you should also add an alerting section to tell Prometheus to send alerts to Alertmanager when the conditions are triggered:
| alerting: | |
| alertmanagers: | |
| - static_configs: | |
| - targets: | |
| - localhost:9093 |
Next, create the alerts.yml file, which Prometheus will read, and add the following to it:
| groups: | |
| - name: be_servers_alert | |
| rules: | |
| - alert: be_servers_no_backends | |
| expr: haproxy_backend_active_servers{proxy="be_servers"} < 1 | |
| for: 15s | |
| labels: | |
| severity: page | |
| annotations: | |
| summary: HAProxy reports all servers are unhealthy for be_app. |
How frequently this rule is checked is set by the evaluation_interval setting in the Prometheus configuration. It defaults to every 15 seconds. With this done, restart Prometheus and visit the Alerts page and you should see that this rule is passing.
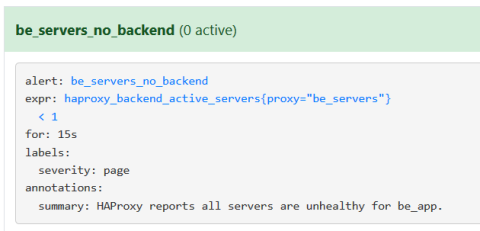
Viewing a Prometheus alert
The Alerts page will show when a rule is currently triggering. However, you have to combine Prometheus with complementary software that will send a notification for the alert.
The next step is to download and configure Alertmanager. When a rule is triggered, Prometheus notifies Alertmanager, which, in turn, sends you details about what occurred. It supports a number of integrations including email, Slack, HipChat, and Pagerduty.
Below is an alertmanager.yml configuration that will send an email notification:
| global: | |
| resolve_timeout: 5m | |
| smtp_from: 'alertmanager@example.com' | |
| smtp_smarthost: example.com:587 | |
| smtp_auth_username: 'username' | |
| smtp_auth_password: 'password' | |
| route: | |
| group_by: ['alertname'] | |
| group_wait: 10s | |
| group_interval: 10s | |
| repeat_interval: 1h | |
| receiver: 'email' |
Now start up Alertmanager and trigger the rule by stopping your backend server(s). Fifteen seconds later, you should have an email describing the issue:
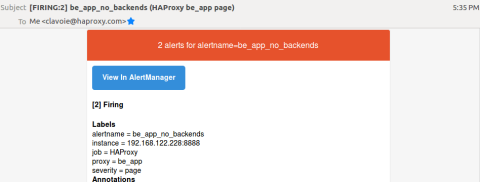
An email notification from Alertmanager
With this setup you can write rules with any valid PromQL query. To get your mind working, here is an example that will alert if the current request rate to the frontend doubles compared to the average request rate over the last 24 hours:
| - alert: fe_main_rate_double | |
| expr: haproxy_frontend_http_requests_rate_current{proxy="fe_main"} > avg_over_time(haproxy_frontend_http_requests_rate_current{proxy="fe_main"}[24h])*2 | |
| for: 15s | |
| labels: | |
| severity: page | |
| annotations: | |
| summary: HAProxy frontend request rate doubled for fe_main |
Conclusion
In this post, we introduced the new, built-in Prometheus endpoint in HAProxy. It exposes more than 150 unique metrics, which makes it even easier to gain visibility into your load balancer and the services that it proxies. Getting it set up requires compiling HAProxy from the source with the exporter included. However, it comes bundled with HAProxy Enterprise, which allows you to install it directly using your system’s package manager.
You can also combine Prometheus with the graphing tool Grafana and the alerting tool Alertmanager. Grafana provides a robust set of graphs to help visualize your data. Alertmanager keeps you in the know about the state of your services. Together, they form a powerful combination of tooling that will help give you essential feedback about your systems.
If you enjoyed this article and want to keep up to date on similar topics, subscribe to this blog! You can also follow us on Twitter and join the conversation on Slack.
Subscribe to our blog. Get the latest release updates, tutorials, and deep-dives from HAProxy experts.