When it comes to operationalizing your log data, HAProxy provides a wealth of information. In this blog post, we demonstrate how to set up HAProxy logging, target a Syslog server, understand the log fields, and suggest some helpful tools for parsing log files.
[On Demand Webinar] Deep Dive Into HAProxy Logging
HAProxy sits in the critical path of your infrastructure. Whether used as a load balancer, API gateway, AI gateway, Kubernetes gateway, or multi-layered security solution, extracting detailed logs from HAProxy is a must.
Logging gives you insights about each connection and request. It enables observability needed for troubleshooting and can even be used to detect problems early. It’s one of the many ways to get information from HAProxy. Other ways include getting metrics using the Stats page or Runtime API, setting up email alerts, and making use of the various open-source integrations for storing log or statistical data over time. HAProxy provides very detailed logs with millisecond accuracy and generates a wealth of information about traffic flowing into your infrastructure. This includes:
Metrics about the traffic: timing data, connections counters, traffic size, etc.
Information about HAProxy decisions: content switching, filtering, persistence, etc.
Information about requests and responses: headers, status codes, payloads, etc.
Termination status of a session and the ability to track where failures are occurring (client side, server side?)
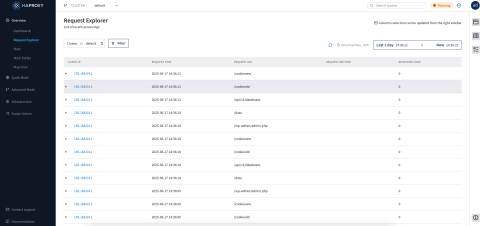
In this post, you’ll learn how to configure HAProxy logging and how to read the log messages that it generates. We’ll then list some tools that you’ll find helpful when operationalizing your log data. You can also use HAProxy Fusion Control Plane to view detailed logs (see below) — including those formatted in JSON or CBOR — plus runtime metrics and dashboards, or optionally export everything to a Prometheus endpoint.
Syslog server
HAProxy can emit log message for processing by a syslog server. This is compatible with familiar syslog tools like Rsyslog, as well as the newer systemd service journald. You can also utilize various log forwarders like Logstash and Fluentd to receive Syslog messages from HAProxy and ship them to a central log aggregator.
If you are working in a container environment, HAProxy supports Cloud Native Logging which allows you to send the log messages to stdout and stderr. In that case, skip to the next section where you’ll see how.
Before looking into how to enable logging via the HAProxy configuration file, you should first make sure that you have a Syslog server, such as rsyslog, configured to receive the logs. On Ubuntu, you’d install rsyslog using the apt package manager, like so:
| sudo apt install -y rsyslog |
Once rsyslog is installed, edit its configuration to handle ingesting HAProxy log messages. Add the following either to /etc/rsyslog.conf or to a new file within the rsyslog.d directory, like /etc/rsyslog.d/haproxy.conf:
| # Collect log with UDP | |
| $ModLoad imudp | |
| $UDPServerAddress 127.0.0.1 | |
| $UDPServerRun 514 | |
| # Creating separate log files based on the severity | |
| local0.* /var/log/haproxy-traffic.log | |
| local0.notice /var/log/haproxy-admin.log |
Then, restart the rsyslog service. In the example above, rsyslog listens on the IP loopback address, 127.0.0.1, on the default UDP port 514. This particular config writes to two log files. The file chosen is based on the severity level with which the message was logged. In order to understand this, take a closer look at the last two lines in the file. They begin like this:
| local0.* ... | |
| local0.notice ... |
The Syslog standard prescribes that each logged message should be assigned a facility code and a severity level. Given the example rsyslog configuration above, you can assume that we’ll be configuring HAProxy to send all of its log messages with a facility code of local0.
The severity level is specified after the facility code, separated by a dot. Here, the first line captures messages at all severity levels and writes them to a file called haproxy-traffic.log. The second line captures only notice-level messages and above, logging them to a file called haproxy-admin.log.
HAProxy is hardcoded to use certain severity levels when sending certain messages. For example, it categorizes log messages related to connections and HTTP requests with the info severity level. Other events are categorized using one of the other, less verbose levels. From most to least important, the severity levels are:
Severity Level | HAProxy Logs |
emerg | Errors such as running out of operating system file descriptors. |
alert | Some rare cases where something unexpected has happened, such as being unable to cache a response. |
crit | Not used. |
err | Errors such as being unable to parse a map file, being unable to parse the HAProxy configuration file, and when an operation on a stick table fails. |
warning | Certain important, but non-critical, errors such as failing to set a request header or failing to connect to a DNS nameserver. |
notice | Changes to a server’s state, such as being UP or DOWN or when a server is disabled. Other events at startup, such as starting proxies and loading modules are also included. Health check logging, if enabled, also uses this level. |
info | TCP connection and HTTP request details and errors. |
debug | You may write custom Lua code that logs debug messages |
Modern Linux distributions are shipped with the service manager systemd, which introduces journald for collecting and storing logs. The journald service is not a Syslog implementation, but it is Syslog compatible since it will listen on the same /dev/log socket. It will collect the received logs and allow the user to filter them by facility code and/or severity level using the equivalent journald fields (SYSLOG_FACILITY, PRIORITY).
HAProxy logging configuration
The HAProxy configuration manual explains that logging can be enabled with two steps: The first is to specify a Syslog server in the global section by using a log directive:
| global | |
| log 127.0.0.1:514 local0 |
The log directive instructs HAProxy to send logs to the Syslog server listening at 127.0.0.1:514. Messages are sent with facility local0, which is one of the standard, user-defined Syslog facilities. It’s also the facility that our rsyslog configuration is expecting. You can add more than one log statement to send output to multiple Syslog servers.
You can control how much information is logged by adding a Syslog level to the end of the line:
| log 127.0.0.1:514 local0 info |
The second step to configuring logging is to update the different proxies (frontend, backend, and listen sections) to send messages to the Syslog server(s) configured in the global section. This is done by adding a log global directive. You can add it to the defaults section, as shown:
| defaults | |
| log global | |
| option httplog |
The log global directive basically says, use the log line that was set in the global section. Putting a log global directive into the defaults section is equivalent to putting it into all of the subsequent proxy sections. So, this will enable logging on all proxies. You can read more about the sections of an HAProxy configuration file in our blog post The Four Essential Sections of an HAProxy Configuration.
By default, output from HAProxy is minimal. Adding the line option httplog to your defaults section will enable more verbose HTTP logging, which we will explain in more detail later.
A typical HAProxy configuration looks like this:
| global | |
| log 127.0.0.1:514 local0 | |
| chroot /var/lib/haproxy | |
| stats socket /run/haproxy/admin.sock mode 660 level admin | |
| stats timeout 30s | |
| user haproxy | |
| group haproxy | |
| daemon | |
| defaults | |
| log global | |
| mode http | |
| option httplog | |
| timeout connect 5s | |
| timeout client 50s | |
| timeout server 50s |
Using global logging rules is the most common HAProxy setup, but you can put them directly into a frontend section instead. It can be useful to have a different logging configuration as a one-off. For example, you might want to point to a different target Syslog server, use a different logging facility, or capture different severity levels depending on the use case of the backend application. Consider the following example in which the frontend sections, fe_site1 and fe_site2, set different IP addresses and severity levels:
| frontend fe_site1 | |
| log 127.0.0.1 local0 notice | |
| # other configuration | |
| frontend fe_site2 | |
| log 127.0.0.2 local0 warning | |
| # other configuration |
When logging to a local Syslog service, writing to a UNIX socket can be faster than targeting the TCP loopback address. Generally, on Linux systems, a UNIX socket listening for Syslog messages is available at /dev/log because this is where the syslog() function of the GNU C library is sending messages by default. Target the UNIX socket like this:
| log /dev/log local0 |
However, you should keep in mind that if you’re going to use a UNIX socket for logging and at the same time you are running HAProxy within a chrooted environment—or you let HAProxy create a chroot directory for you by using the chroot configuration directive—then the UNIX socket must be made available within that chroot directory. This can be done in one of two ways.
First, when rsyslog starts up, it can create a new listening socket within the chroot filesystem. Add the following to your HAProxy rsyslog configuration file:
| $ModLoad imuxsock | |
| $AddUnixListenSocket /var/lib/haproxy/dev/log |
The second way is to manually add the socket to the chroot filesystem by using the mount command with the --bind option.
| mkdir /var/lib/haproxy/dev/ | |
| touch /var/lib/haproxy/dev/log | |
| mount --bind /dev/log /var/lib/haproxy/dev/log |
Be sure to add an entry to your /etc/fstab file or to a systemd unit file so that the mount persists after a reboot. Once you have logging configured, you’ll want to understand how the messages are structured. In the next section, you’ll see the fields that make up the TCP and HTTP-level logs.
If you need to limit the amount of data stored, one way is to sample only a portion of log messages. Set the log level to silent for a random number of requests, like so:
| frontend website | |
| http-request set-log-level silent unless { rand(100) lt 5 } |
Note that, if possible, it’s better to capture as much data as you can. That way, you don’t have missing information when you need it most. You can also modify the ACL expression so that certain conditions override the rule.
| http-request set-log-level silent unless { rand(100) lt 5 } OR <SOME_CONDITION> |
A new way to sample logs is available. Read about HAProxy Log Sampling.
Another way to limit the number of messages logged is to set option dontlog-normal in your defaults or frontend. That way, only timeouts, retries and errors are captured. You probably would not want to enable this all of the time, but only during certain times, such as when performing benchmarking tests.
If you are running HAProxy inside of a Docker container and you’re using HAProxy version 1.9, then instead of sending log output to a Syslog server you can send it to stdout and/or stderr. Set the address to stdout or stderr, respectively. In that case, it’s also preferable to set the format of the message to raw, like so:
| global | |
| log stdout format raw local0 info |
HAProxy log format
The type of logging you’ll see is determined by the proxy mode that you set within HAProxy. HAProxy can operate either as a Layer 4 (TCP) proxy or as Layer 7 (HTTP) proxy. TCP mode is the default. In this mode, a full-duplex connection is established between clients and servers, and no layer 7 examination will be performed. If you’ve set your rsyslog configuration based on our discussion in the first section, you’ll find the log file at /var/log/haproxy-traffic.log.
When in TCP mode, which is set by adding mode tcp, you should also add option tcplog. With this option, the log format defaults to a structure that provides useful information like Layer 4 connection details, timers, byte count, etc. If you were to re-create this format using log-format, which is used to set a custom format, it would look like this:
| log-format "%ci:%cp [%t] %ft %b/%s %Tw/%Tc/%Tt %B %ts %ac/%fc/%bc/%sc/%rc %sq/%bq" |
Descriptions of these fields can be found in the TCP log format documentation, although we’ll describe several in the upcoming section.
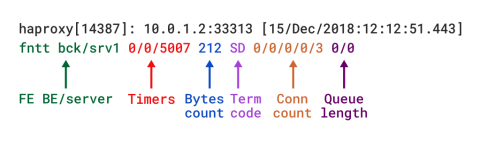
TCP log format in HAProxy
When HAProxy is run as a Layer 7 proxy via mode http, you should add the option httplog directive. It ensures that HTTP requests and responses are analyzed in depth and that no RFC-compliant content will go uncaptured. This is the mode that really highlights the diagnostic value of HAProxy. The HTTP log format provides the same level of information as the TCP format, but with additional data specific to the HTTP protocol. If you were to re-create this format using log-format, it would look like this:
| log-format "%ci:%cp [%tr] %ft %b/%s %TR/%Tw/%Tc/%Tr/%Ta %ST %B %CC %CS %tsc %ac/%fc/%bc/%sc/%rc %sq/%bq %hr %hs %{+Q}r" |
Detailed descriptions of the different fields can be found in the HTTP log format documentation.
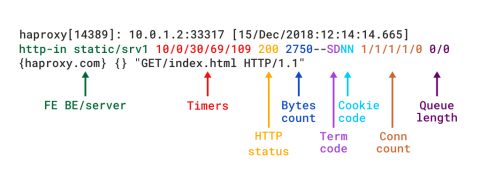
HTTP log format in HAProxy
You can also define a custom log format, capturing only what you need. Use the log-format (or log-format-sd for structured-data syslog) directive in your defaults or frontend. Read our blog post HAProxy Log Customization to learn more and see some examples.
In the next few sections, you’ll become familiar with the fields that are included when you use option tcplog or option httplog.
Proxies
Within the log file that’s produced, each line begins with the frontend, backend, and server to which the request was sent. For example, if you had the following HAProxy configuration, you would see lines that describe requests as being routed through the http-in frontend to the static backend and then to the srv1 server.
| frontend http-in | |
| bind :80 | |
| default_backend static | |
| backend static | |
| server srv1 192.168.1.10:80 check | |
| server srv2 192.168.1.11:80 check |
This becomes vital information when you need to know where a request was sent, such as when seeing errors that only affect some of your servers.
Timers
Timers are provided in milliseconds and cover the events happening during a session. The timers captured by the default TCP log format are Tw / Tc / Tt. Those provided by the default HTTP log format are TR / Tw/ Tc / Tr / Ta. These translate as:
Timer | Meaning |
TR | The total time to get the client request (HTTP mode only). |
Tw | The total time spent in the queues waiting for a connection slot. |
Tc | The total time to establish the TCP connection to the server. |
Tr | The server response time (HTTP mode only). |
Ta | The total active time for the HTTP request (HTTP mode only). |
Tt | The total TCP session duration time, between the moment the proxy accepted it and the moment both ends were closed. |
You’ll find a detailed description of all of the available timers in the HAProxy documentation. The following diagram also demonstrates where time is recorded during a single end-to-end transaction. Note that the purple lines on the edges denote timers.
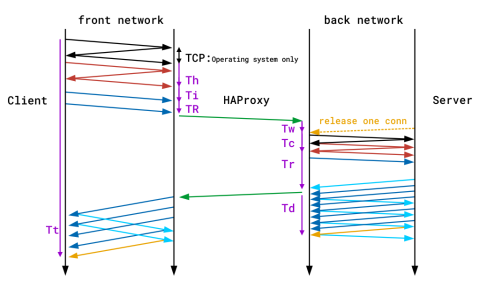
Time recording during a single end-to-end transaction
Session state at disconnection
Both TCP and HTTP logs include a termination state code that tells you the way in which the TCP or HTTP session ended. It’s a two-character code. The first character reports the first event that caused the session to terminate, while the second reports the TCP or HTTP session state when it was closed.
Here are some termination code examples:
Two-character code | Meaning |
— | Normal termination on both sides. |
cD | The client did not send nor acknowledge any data and eventually |
SC | The server explicitly refused the TCP connection. |
PC | The proxy refused to establish a connection to the server because the process’ socket limit was reached while attempting to connect. |
There’s a wide variety of reasons a connection may have been closed. Detailed information about all possible termination codes can be found in the HAProxy documentation.
Counters
Counters indicate the health of the system when a request went through. HAProxy records five counters for each connection or request. They can be invaluable in determining how much load is being placed on the system, where the system is lagging, and whether limits have been hit. When looking at a line within the log, you’ll see the counters listed as five numbers separated by slashes: 0/0/0/0/0.
In either TCP or HTTP mode, these break down as:
The total number of concurrent connections on the HAProxy process when the session was logged.
The total number of concurrent connections routed through this
frontendwhen the session was logged.The total number of concurrent connections routed to this
backendwhen the session was logged.The total number of concurrent connections still active on this
serverwhen the session was logged.The number of retries attempted when trying to connect to the backend server.
Other fields
HAProxy doesn’t record everything out-of-the-box, but you can tweak it to capture what you need. An HTTP request header can be logged by adding the http-request capture directive:
| frontend website | |
| bind :80 | |
| http-request capture req.hdr(Host) len 10 | |
| http-request capture req.hdr(User-Agent) len 100 | |
| default_backend webservers |
The log will show headers between curly braces and separated by pipe symbols. Here you can see the Host and User-Agent headers for a request:
| 192.168.160.1:57190 [20/Dec/2018:22:20:00.899] website~ webservers/server1 0/0/1/0/1 200 462 - - ---- 1/1/0/0/0 0/0 {mywebsite.com|Mozilla/5.0 (X11; Linux x86_64) AppleWebKit/537.36 (KHTML, like Gecko) Ubuntu Chromium/71.0.3578.80 } "GET / HTTP/1.1" |
A response header can be logged by adding an http-response capture directive:
| frontend website | |
| bind :80 | |
| declare capture response len 20 | |
| http-response capture res.hdr(Server) id 0 | |
| declare capture response len 20 | |
| http-response capture res.hdr(Content-Type) id 1 | |
| default_backend webservers |
In this case, you must also add a declare capture response directive, which allocates a capture slot where the response header, once it arrives, can be stored. Each slot that you add is automatically assigned an ID starting from zero. Reference this ID when calling http-response capture. Response headers are logged after the request headers, within a separate set of curly braces.
Cookie values can be logged in a similar way with the http-request capture directive.
| frontend website | |
| bind :80 | |
| http-request capture req.cook(MyCookie) len 20 | |
| default_backend webservers |
Anything captured with http-request capture, including HTTP headers and cookies, will appear within the same set of curly braces. The same goes for anything captured with http-response capture.
You can also use http-request capture to log sampled data from stick tables. If you were tracking user request rates with a stick-table, you could log them like this:
| frontend website | |
| bind :80 | |
| stick-table type ip size 1m expire 10s store http_req_rate(10s) | |
| http-request track-sc0 src | |
| http-request capture sc_http_req_rate(0) len 4 | |
| default_backend webservers |
So, making a request to a webpage that contains the HTML document and two images would show the user’s concurrent request rate incrementing to three:
| 192.168.160.1:49972 [20/Dec/2018:21:58:00.129] website~ webservers/server1 0/0/3/1/4 200 462 - - ---- 2/2/0/0/0 0/0 {1} "GET / HTTP/1.1" | |
| 192.168.160.1:49972 [20/Dec/2018:21:58:00.175] website~ webservers/server1 0/0/0/3/68 200 1000182 - - ---- 2/2/1/1/0 0/0 {2} "GET /img1.jpg HTTP/1.1" | |
| 192.168.160.1:49972 [20/Dec/2018:21:58:00.175] website~ webservers/server1 0/0/0/3/68 200 1000182 - - ---- 2/2/0/0/0 0/0 {3} "GET /img2.jpg HTTP/1.1" |
You can also log the values of fetch methods, such as to record the version of SSL/TLS that was used (note that there is a built-in log variable for getting this called %sslv):
| # logs 'TLSv1.2' | |
| http-request capture ssl_fc_protocol len 10 |
Variables set with http-request set-var can also be logged.
| frontend website | |
| bind :80 | |
| http-request set-var(req.MyVariable) str("My Value") if SOME_CONDITION | |
| http-request capture var(req.MyVariable) len 10 |
ACL expressions evaluate to either true or false. You can’t log them directly, but you can set a variable based on whether the expression is true. For example, if the user visits /api, you could set a variable called req.is_api to a value of Is API and then capture that in the logs.
| acl is_api path_beg /api | |
| http-request set-var(req.is_api) str("Not API") | |
| http-request set-var(req.is_api) str("Is API") if is_api | |
| http-request capture var(req.is_api) len 10 |
Enabling HAProxy profiling
With the release of HAProxy 1.9, you can record CPU time spent on processing a request within HAProxy. Add the profiling.tasks directive to your global section:
| global | |
| profiling.tasks on |
There are new fetch methods that expose the profiling metrics:
Fetch method | Description |
| The microseconds part of the date. |
| The number of calls to the task processing the stream or current request since it was allocated. It is reset for each new request on the same connection. |
| The average number of nanoseconds spent in each call to the task processing the stream or current request. |
| The total number of nanoseconds spent in each call to the task processing the stream or current request. |
| The average number of nanoseconds spent between the moment the task handling the stream is woken up and the moment it is effectively called. |
| The total number of nanoseconds between the moment the task handling the stream is woken up and the moment it is effectively called. |
Add these to your log messages like this:
| log-format "%{+Q}r cpu_calls:%[cpu_calls] cpu_ns_tot:%[cpu_ns_tot] cpu_ns_avg:%[cpu_ns_avg] lat_ns_tot:%[lat_ns_tot] lat_ns_avg:%[lat_ns_avg]" | |
| # Outputs: "GET / HTTP/1.1" cpu_calls:2 cpu_ns_tot:7928946 cpu_ns_avg:3964473 lat_ns_tot:49814 lat_ns_avg:24907 |
This is a great way to gauge which requests cost the most to process.
Parsing HAProxy logs
As you’ve learned, HAProxy has a lot of fields that provide a tremendous amount of insight about connections and requests. However, reading them directly can lead to information overload. Oftentimes, it’s easier to parse and aggregate them with external tools. In this section, you’ll see some of these tools and how they can leverage the logging information provided by HAProxy.
HALog
HALog is a small but powerful log analysis tool that’s shipped with HAProxy. It was designed to be deployed onto production servers where it can help with manual troubleshooting, such as when facing live issues. It is extremely fast and able to parse TCP and HTTP logs at 1 to 2 GB per second. By passing it a combination of flags, you can extract statistical information from the logs, including requests per URL and requests per source IP. Then, you can sort by the response time, error rate, and termination code.
For example, if you wanted to extract per-server statistics from the logs, you could use the following command:
| $ halog -srv -H < haproxy.log | column -t | |
| 190000 lines in, 10 lines out, 0 parsing errors | |
| #srv_name 1xx 2xx 3xx 4xx 5xx other tot_req req_ok pct_ok avg_ct avg_rt | |
| api/web5 0 12969 163 851 0 1 13984 13983 100.0 0 60 | |
| api/web6 0 12976 149 854 5 0 13984 13979 100.0 1 150 | |
| httpd/<NOSRV> 0 0 8 0 0 0 8 0 0.0 0 0 | |
| httpd/web1 84 534 0 6 2 0 626 626 100.0 0 342 | |
| httpd/web2 72 3096 0 9 10 0 3187 3183 99.9 1 1509 | |
| static/static1 0 74491 171 17 1 0 74680 74679 100.0 0 2 | |
| static/static2 0 72989 155 11 0 0 73155 73155 100.0 1 4 | |
| stats/<STATS> 0 465 0 0 0 0 465 458 98.5 0 0 |
This is useful when you need to parse log lines per status code and quickly discover if a given server is unhealthy (e.g. returning too many 5xx responses). Or, a server may be denying too many requests (4xx responses), which is a sign of a brute-force attack. You can also get the average response time per server with the avg_rt column, which is helpful for troubleshooting.
With HALog, you can get per-URL statistics by using the following command:
| $ halog -ut -H < haproxy.log | column -t | |
| 190000 lines in, 1057 lines out, 0 parsing errors | |
| #req err ttot tavg oktot okavg bavg btot src | |
| 9591 18 13988347 1458 13529888 1413 19383 185905503 /socket.io/ | |
| 5849 1 429608 73 369605 63 3383 19791913 /api/items | |
| 201 1 243619 1212 243412 1217 342 68800 /genius/ws/log | |
| 52 0 110684 2128 110684 2128 702 36538 /api/items/ | |
| 122 0 103800 850 103800 850 67781 8269340 /api/events/14782/items |
The output shows the number of requests, the number of errors, the total computation time, the average computation time, the total computation time of successful requests, the average computation time of successful requests, the average number of bytes sent, and the total number of bytes sent. In addition to parsing server and URL statistics, you can apply multiple filters to match logs with a given response time, HTTP status code, session termination code, etc.
Learn More: What is HAProxy?
HAProxy stats page
Parsing the logs with HALog isn’t the only way to get metrics out of HAProxy. The HAProxy Stats Page can be enabled by adding the stats enable directive to a frontend or listen section. It displays live statistics of your servers. The follow listen section starts the Stats page listening on port 8404:
| listen stats | |
| bind *:8404 | |
| stats enable | |
| stats uri / | |
| stats refresh 5s |
The Stats Page is very useful for getting instant information about the traffic flowing through HAProxy. It does not store this data, though, and displays data only for a single load balancer.
To log a specific HTTP header or cookie, use the http-request capture directive in your frontend. For a header, use req.hdr(), and for a cookie, use req.cook(). You can find more advanced examples in our HAProxy log customization blog.
Header: http-request capture req.hdr(User-Agent) len 100
Cookie: http-request capture req.cook(MyCookie) len 20
Conclusion
In this blog post, you learned how to configure HAProxy logging to get observability over your load balancer, which is a critical component within your infrastructure. HAProxy emits detailed Syslog messages when operating in either TCP and HTTP mode. These can be sent to a number of logging tools, such as rsyslog.
HAProxy ships with the HALog command-line utility, which simplifies parsing log data when you need information about the types of responses users are getting and the load on your servers. You can also get a visual of the health of your servers using HAProxy Fusion's Stats interface, located under Overview > Stats in the left sidebar.
Subscribe to our blog. Get the latest release updates, tutorials, and deep-dives from HAProxy experts.