HAProxy integrates with AWS X-Ray to give you the best observability across your Amazon Web Services (AWS) resources, including your load balancer. Read on to learn how.
There is a trend to move away from monolithic applications towards microservices. Microservices run within separate processes, often on different machines where interservice communication happens over a network. This makes debugging more challenging. In the past, a single, process-level stack trace would have told you everything you needed to know. Now, to follow the path of a request across a network of services, the approach must be different.
Distributed tracing lets you profile applications that are distributed across processes and machines. At each stage, the request is tagged with a consistent identifier that allows you to map out and sequence the full journey. You can also see latency at and between each service, enabling you to zero in on problem areas.
HAProxy is somewhat legendary for its level of observability. If you haven’t already, read our blog post, Introduction to HAProxy Logging. It explains how the HAProxy logs provide detailed insights about each request and response that comes through, including giving you a termination code that describes how each session ended (e.g. was the request intentionally blocked, or was there a server error while getting the response?). HAProxy also has a built-in dashboard that gives you a near real-time feed of information about your proxied services. You can read more about it in our blog post, Exploring the HAProxy Stats Page.
In the post, you’ll see how HAProxy integrates with AWS X-Ray. AWS X-Ray is a hosted distributed tracing tool built into the AWS cloud services platform. It lets you track the path of a request through each service-to-service hop. The time spent at each step is recorded and displayed on a dashboard. It also provides a map showing how your services are connected.
Daniel Corbett, Director of Product at HAProxy Technologies, gave a presentation about this topic at AWS re:Invent. Check it out here:
Tracing with AWS X-Ray
Here’s how AWS X-Ray works: When a request passes through instrumented code or infrastructure, data is captured and forwarded to the X-Ray service, which is hosted on AWS. This data is in the form of segments. As found in the AWS X-Ray API documentation, segments are JSON representations of requests that a service has processed. They record information about the host, the original request, time spent doing work, and any faults and exceptions encountered. They may also include subsegments with information about calls that the application makes to upstream AWS resources, HTTP APIs, and databases that aren’t natively integrated with X-Ray.
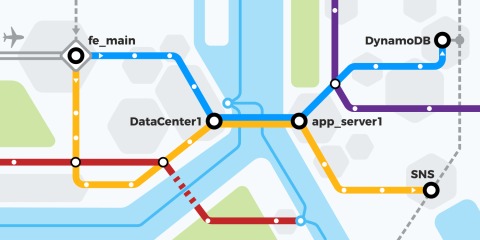
By virtue of a unique identifier that’s attached to the request as it passes through each component, segments can be assembled into a trace. When viewed in the console, traces are visualized as charts that show time spent at each service.
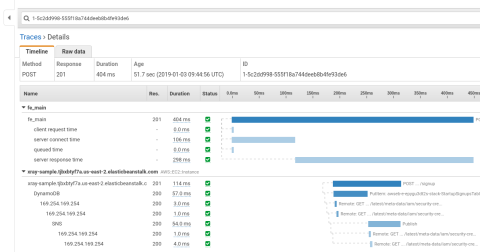
The AWS X-Ray Traces screen
The X-Ray also provides a service graph that gives you an overview of how requests are flowing through your system. You can then answer questions such as: Where is latency happening? Which services are producing errors? How much is a service being utilized?
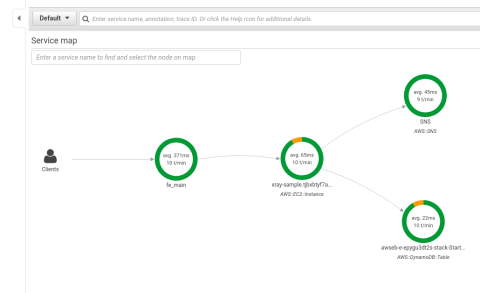
View the X-Ray service map
Many times, people leverage HAProxy as their edge proxy on AWS because of the additional features and flexibility that it offers. When you use HAProxy on AWS, you can add the fine-grained metrics you get with HAProxy to the high-level visibility you get with X-Ray.
Deploying the AWS X-Ray sample project
To get up and running fast, you can use the sample project provided by AWS. Log into the AWS console and go to the AWS X-Ray Getting Started tab. From there, you can launch a premade Node.js application that comes equipped to send X-Ray segments. Follow these steps:
Choose to launch a sample application (Node.js).
Follow the given instructions to deploy the application via CloudFormation and Elastic Beanstalk.
When asked to select a VPC and subnet, choose one of the premade defaults from the lists. There’s quite a bit to set up if you decide to create your own VPC and subnet (Internet gateways, route tables, etc.), so selecting an existing VPC and subnet will be quicker.
After CloudFormation finishes building the app, look for the ElasticBeanstalkEnvironmentURL key in the Outputs tab on the CloudFormation Stacks screen.
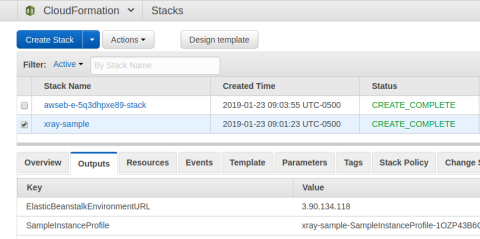
View the ElasticBeanstalkEnvironmentURL
Enter that URL into your browser to view the sample application.
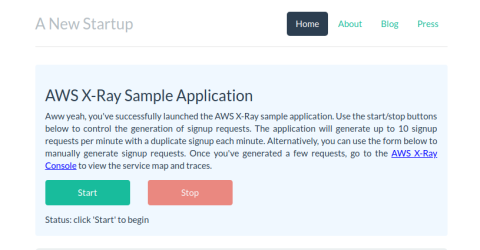
Visit the sample application
After you’ve completed this tutorial and you’re ready to remove the AWS resources, you can delete the entire application by using the CloudFormation dashboard.
Getting X-Ray segments from HAProxy
The sample project is available on GitHub. It uses Docker Compose to spin up a small environment on your local workstation. It creates a Docker container running HAProxy and another container running the X-Ray daemon and rsyslog.
The load balancer proxies requests to an echo service by default, which works for sending data to the X-Ray service, but you can change the server address in the HAProxy configuration to point to the application you deployed using CloudFormation in the previous section to get a more realistic trace. HAProxy logs requests to rsyslog, which formats the data into JSON segments and sends them to the X-Ray daemon. The daemon then forwards the segments to the X-Ray service in AWS.
For the rest of this post, we’ll dig into the mechanics of how the individual pieces work together. Then, you’ll see the final result, which includes a complete trace of each request as it passes through the system.
Installing the X-Ray daemon
The X-Ray daemon is software that listens on UDP port 2000 and forwards segment data to the X-Ray service hosted on AWS. The sample project installs it into a Docker container, but you can download and install it into the environment of your choice. It’s available as both an executable and as an RPM or Debian package.
You configure the X-Ray daemon by editing /etc/amazon/xray/cfg.yaml. You should only need to fill in the Region, which the sample projects sets to us-east-2 (Ohio), and set LocalMode to true if you aren’t running the daemon on EC2. Everything else can be left as is. You may also want to set a more verbose LogLevel (e.g. dev) until you’ve ironed out any issues.
If you decide to set LogPath to save the daemon’s logs somewhere other than the default of /var/log/xray/xray.log, you’ll also need to edit its Systemd unit file, /lib/systemd/system/xray.service, in which the same path is hardcoded via the ExecStart= field.
Your file will look like this:
| TotalBufferSizeMB: 0 | |
| Concurrency: 8 | |
| Region: "us-east-2" | |
| Endpoint: "" | |
| Socket: | |
| UDPAddress: "127.0.0.1:2000" | |
| TCPAddress: "127.0.0.1:2000" | |
| Logging: | |
| LogRotation: true | |
| LogLevel: "prod" | |
| LogPath: "" | |
| LocalMode: true | |
| ResourceARN: "" | |
| RoleARN: "" | |
| NoVerifySSL: false | |
| ProxyAddress: "" | |
| Version: 2 |
Next, allow the daemon to send data to the X-Ray service by creating user credentials that include the AWSXRayDaemonWriteAccess permission. If you’ve installed X-Ray as an RPM or Debian package, then a user named xray will have been created for you locally. So, save the access key and secret key to a file at /home/xray/.aws/credentials. Or, if the X-Ray daemon is running as another user, such as root, copy the credentials file to that user’s .aws directory. It will look like this:
| [default] | |
| aws_access_key_id = ABCDE12345 | |
| aws_secret_access_key = DEFGHIJK1234567890 |
Afterward, reload the X-Ray service:
| $ sudo systemctl restart xray |
Note that the sample projects run the daemon in a container and use a bash script to set up and initialize it. The daemon logs to a file at /var/log/xray/xray.log. You should see something like this (with more or less verbosity, depending on your configuration) telling you that the service has started successfully:
| [Info] Initializing AWS X-Ray daemon 3.0.0 | |
| [Debug] Listening on UDP 127.0.0.1:2000 | |
| [Info] Using buffer memory limit of 9 MB | |
| [Info] 144 segment buffers allocated | |
| [Debug] Using proxy address: | |
| [Debug] Fetch region us-east-2 from commandline/config file | |
| [Info] Using region: us-east-2 | |
| [Debug] ARN of the AWS resource running the daemon: | |
| [Debug] No Metadata set for telemetry records | |
| [Debug] Using Endpoint: https://xray.us-east-2.amazonaws.com | |
| [Debug] Telemetry initiated | |
| [Debug] Using Endpoint: https://xray.us-east-2.amazonaws.com | |
| [Debug] Batch size: 50 | |
| [Info] Starting proxy http server on 127.0.0.1:2000 |
In the next section, you’ll see how to configure rsyslog to ingest metrics from HAProxy and relay them to the X-Ray daemon, which in turn will send them to the hosted X-Ray service.
Setting up rsyslog
HAProxy is designed to send its logs to a Syslog-compatible log processor, like rsyslog. The nice thing about rsyslog is that it can process each log message and convert it into X-Ray compatible JSON.
In our HAProxy configuration, we define a custom log format that delimits each field by a pipe character. We then use the Fields Extraction Module in rsyslog to split the HAProxy log line up by that designated character and then place the resulting values into a JSON template. Then, we use the Forwarding Output Module to send the generated JSON to the X-Ray daemon.
To set this up, we modify the HAProxy rsyslog configuration, which may already exist as a file named /etc/rsyslog.d/49-haproxy.conf. Here’s how it should look when everything is said and done, with some parts removed for brevity:
| module(load="imudp") | |
| module(load="mmfields") | |
| module(load="omfwd") | |
| $UDPServerAddress * | |
| $UDPServerRun 514 | |
| # Define the JSON template | |
| template(name="jsondump" type="list") { | |
| constant(value="{\"format\": \"json\", \"version\": 1}\n") | |
| constant(value="{") | |
| property(outname="name" name="$!f4" format="jsonf") constant(value=",") | |
| property(outname="id" name="$!f28" format="jsonf") constant(value=",") | |
| constant(value="\"start_time\":") property(name="$.start_time_seconds_with_ms") constant(value=",") | |
| constant(value="\"end_time\":") property(name="$.end_time_seconds_with_ms") constant(value=",") | |
| property(outname="trace_id" name="$!f27" format="jsonf") constant(value=",") | |
| constant(value="\"annotations\": {") | |
| property(outname="termination_code" name="$!f16" format="jsonf") | |
| constant(value="}") | |
| constant(value="}") | |
| } | |
| if $programname == "haproxy" then { | |
| # Split log line by pipe character | |
| action(type="mmfields" separator="|") | |
| # Split up termination state code | |
| set $.first_event = substring($!f16, 0, 1); | |
| set $.session_state = substring($!f16, 1, 1); | |
| # Calculate timing values | |
| set $.start_time = $!f3 * 1000; # timestamp ms | |
| set $.start_time_ms = $.start_time + $.start_time_remainder_ms; # timestamp ms + subseconds | |
| set $.start_time_seconds = $.start_time_ms / 1000; | |
| set $.start_time_remainder_ms = $.start_time_ms % 1000; | |
| set $.start_time_seconds_with_ms = cstr($.start_time_seconds) & "." & cstr($.start_time_remainder_ms); | |
| set $.total_time = $!f11; # total time ms | |
| set $.end_time_ms = $.start_time_ms + cnum($.total_time); | |
| set $.end_time_seconds = cnum($.end_time_ms) / 1000; | |
| set $.end_time_remainder_ms = cnum($.end_time_ms) % 1000; | |
| set $.end_time_seconds_with_ms = cstr($.end_time_seconds) & "." & cstr($.end_time_remainder_ms); | |
| # Forward output to X-Ray daemon | |
| action(type="omfwd" | |
| Target="127.0.0.1" | |
| Port="2000" | |
| Protocol="udp" | |
| Template="jsondump") | |
| # Normal log to file | |
| /var/log/haproxy.log | |
| stop | |
| } |
Restart the rsyslog service for the changes to take effect. When a request comes through HAProxy and gets logged to rsyslog, JSON is produced that looks like this:
| { | |
| "metadata":{ | |
| "session_state_at_disconnection":{ | |
| "code":"--", | |
| "first_event":{ | |
| "code":"-" | |
| }, | |
| "session_state":{ | |
| "code":"-" | |
| } | |
| }, | |
| "connections":{ | |
| "frontend":1, | |
| "backend":0, | |
| "active":1, | |
| "server":1, | |
| "retries":0 | |
| }, | |
| "queue":{ | |
| "backend":"0", | |
| "server":"0" | |
| } | |
| }, | |
| "http":{ | |
| "request":{ | |
| "client_ip":"192.168.50.1", | |
| "method":"GET", | |
| "user_agent":"Mozilla/5.0 (Windows NT 10.0; Win64; x64; rv:64.0) Gecko/20100101 Firefox/64.0", | |
| "url":"https://192.168.50.20/" | |
| }, | |
| "response":{ | |
| "content_length":180, | |
| "status":304 | |
| } | |
| }, | |
| "subsegments":[ | |
| { | |
| "name":"client request time", | |
| "start_time":1548450631.575, | |
| "end_time":1548450631.575, | |
| "id":"e489b0cd0d0257db" | |
| }, | |
| { | |
| "name":"queued time", | |
| "start_time":1548450631.575, | |
| "end_time":1548450631.575, | |
| "id":"c04e1af794b416c1" | |
| }, | |
| { | |
| "name":"server connect time", | |
| "start_time":1548450631.575, | |
| "end_time":1548450631.575, | |
| "id":"5b87e848d757bffa" | |
| }, | |
| { | |
| "name":"server response time", | |
| "start_time":1548450631.575, | |
| "end_time":1548450631.576, | |
| "id":"cdb0b85ec2bb843d" | |
| } | |
| ], | |
| "end_time":1548450631.576, | |
| "id":"7ccbed1a542b32aa", | |
| "trace_id":"1-5c4b7b47-2046a5bd0f3c747c6cedf6cb", | |
| "annotations":{ | |
| "termination_code":"--" | |
| }, | |
| "start_time":1548450631.575, | |
| "name":"fe_main~" | |
| } |
The HAProxy configuration
Setting things up on the HAProxy side is mostly a series of manipulating HTTP headers and configuring a custom log format. You have two primary tasks:
Send the HAProxy segment data, via rsyslog, to the X-Ray daemon so that the load balancer is included in the trace.
Attach a unique identifier to each request as it passes through so that upstream services can attach the same ID to their segment data.
The first task is to send the HAProxy segment data to rsyslog. In this case, since we’re proxying HTTP traffic, we include the fields required by the X-Ray service—name, id, trace_id, start_time, and end_time—and optional fields pertaining to HTTP traffic—method, status code, etc. We also include HAProxy-specific metrics such as connection counters, termination indicators, and timing values.
The second task is to add a unique identifier to the request as an HTTP header called X-Amzn-Trace-Id. This is typically done by the first component in the trace. HAProxy will likely be the first, so adding the header makes sense. Per the X-Ray documentation, a trace ID consists of three numbers separated by hyphens. Here’s an example header:
| X-Amzn-Trace-Id: Root=1-5c4b5f4c-751f363f251259f72bbbc792 |
The first number is the version (set to 1). The second is the start time of the request as an eight-character, hexadecimal, Unix-epoch time. The third is a 96-bit, globally-unique identifier for the trace, represented as 24 hexadecimal digits.
Here’s how your HAProxy configuration will look:
| global | |
| log 127.0.0.1:514 local0 | |
| defaults | |
| log global | |
| mode http | |
| option httplog | |
| timeout connect 20s | |
| timeout client 30s | |
| timeout server 30s | |
| timeout http-request 30s | |
| frontend fe_main | |
| bind :80 | |
| # Create custom headers as temporary holding places for info | |
| http-request set-header X-Scheme http | |
| http-request set-header X-Scheme https if { ssl_fc } | |
| http-request set-header X-TraceId %[rand,hex,bytes(8,8),lower]%[rand,hex,bytes(8,8),lower]%[rand,hex,bytes(8,8),lower] | |
| http-request set-header X-SegmentId1 %[rand,hex,bytes(8,8),lower]%[rand,hex,bytes(8,8),lower] | |
| http-request set-header X-SegmentId2 %[rand,hex,bytes(8,8),lower]%[rand,hex,bytes(8,8),lower] | |
| http-request set-header X-SegmentId3 %[rand,hex,bytes(8,8),lower]%[rand,hex,bytes(8,8),lower] | |
| http-request set-header X-SegmentId4 %[rand,hex,bytes(8,8),lower]%[rand,hex,bytes(8,8),lower] | |
| http-request set-header X-SegmentId5 %[rand,hex,bytes(8,8),lower]%[rand,hex,bytes(8,8),lower] | |
| # Declare capture slots for logging headers | |
| declare capture request len 512 | |
| http-request capture req.fhdr(User-Agent) id 0 | |
| declare capture request len 5 | |
| http-request capture req.hdr(X-Scheme) id 1 | |
| declare capture request len 512 | |
| http-request capture req.hdr(Host) id 2 | |
| declare capture request len 24 | |
| http-request capture req.hdr(X-TraceId) id 3 | |
| declare capture request len 16 | |
| http-request capture req.hdr(X-SegmentId1) id 4 | |
| declare capture request len 16 | |
| http-request capture req.hdr(X-SegmentId2) id 5 | |
| declare capture request len 16 | |
| http-request capture req.hdr(X-SegmentId3) id 6 | |
| declare capture request len 16 | |
| http-request capture req.hdr(X-SegmentId4) id 7 | |
| declare capture request len 16 | |
| http-request capture req.hdr(X-SegmentId5) id 8 | |
| declare capture response len 8 | |
| http-response capture res.hdr(Content-Length) id 0 | |
| # Generate a unique Trace ID | |
| unique-id-format %{+X}o\ 1-%[date,hex,bytes(8,8),lower]-%[capture.req.hdr(3)] | |
| http-request set-header X-Amzn-Trace-Id Root=%[unique-id,lower] | |
| # The fields to log: | |
| # ci = client IP | |
| # cp = client port | |
| # Ts = timestamp | |
| # ft = frontend name | |
| # b = backend name | |
| # s = server name | |
| # TR = time to receive 1st byte | |
| # Tw = time spent waiting in queue | |
| # Tc = time spent to establish server connection | |
| # Tr = server response time | |
| # Ta = total active time of request | |
| # ST = status code | |
| # B = bytes read | |
| # CC = captured request cookie | |
| # CS = captured response cookie | |
| # ts = termination state code | |
| # ac = active connections | |
| # fc = frontend connections | |
| # bc = backend connections | |
| # sc = server connections | |
| # rc = number of retries | |
| # sq = connections queued for server | |
| # bq = requests processed before this one | |
| # capture.req.method = HTTP method | |
| # capture.req.hdr(0) = User-Agent | |
| # scheme://URL | |
| # ID = trace ID | |
| # segment ID 1 | |
| # segment ID 2 | |
| # segment ID 3 | |
| # segment ID 4 | |
| # segment ID 5 | |
| # capture.res.hdr(0) = Content-Length | |
| log-format "%ci|%cp|%Ts|%ft|%b|%s|%TR|%Tw|%Tc|%Tr|%Ta|%ST|%B|%CC|%CS|%ts|%ac|%fc|%bc|%sc|%rc|%sq|%bq|%[capture.req.method]|%[capture.req.hdr(0)]|%[capture.req.hdr(1)]://%[capture.req.hdr(2)]%HP|%ID|%[capture.req.hdr(4)]|%[capture.req.hdr(5)]|%[capture.req.hdr(6)]|%[capture.req.hdr(7)]|%[capture.req.hdr(8)]|%[capture.res.hdr(0)]" | |
| default_backend be_servers | |
| backend be_servers | |
| server s1 server:80 check |
Let’s break this down to better understand what it does. The following http-request set-header lines store the scheme (http or https), trace ID, and segment ID in custom HTTP request headers. Request headers are a convenient place to store data.
| http-request set-header X-Scheme http if !{ ssl_fc } | |
| http-request set-header X-Scheme https if { ssl_fc } | |
| http-request set-header X-TraceId %[rand,hex,bytes(8,8),lower]%[rand,hex,bytes(8,8),lower]%[rand,hex,bytes(8,8),lower] | |
| http-request set-header X-SegmentId %[rand,hex,bytes(8,8),lower]%[rand,hex,bytes(8,8),lower] |
The trace ID is the unique identifier for the entire trace. The segment ID distinguishes the current segment from others. Both are populated using the same combination of sample fetches and converters:
randreturns an integer between 0 and 2^32hexconverts it to a hex stringbytesextracts eight digits from this hex string
We do that three times for X-TraceId to get a 96-bit identifier as 24 hexadecimal digits. We only do that two times for the X-SegmentId headers. Note that we’re creating several segment IDs because we’re going to send subsegments that contain additional timings: the client request time, queued time, server connect time and server response time.
Next, the declare capture and http-request capture lines create capture slots or places where you can store data that you wish to log and fill them with the values of the request headers. Note that we set id parameters for each, which is how the fields can be referenced later in log-format.
| declare capture request len 512 | |
| http-request capture req.fhdr(User-Agent) id 0 | |
| declare capture request len 5 | |
| http-request capture req.hdr(X-Scheme) id 1 | |
| declare capture request len 512 | |
| http-request capture req.hdr(Host) id 2 | |
| declare capture request len 24 | |
| http-request capture req.hdr(X-TraceId) id 3 | |
| declare capture request len 16 | |
| http-request capture req.hdr(X-SegmentId1) id 4 |
Next, we set the X-Amz-Trace-Id request header. The unique-id-format directive configures the format of the ID and unique-id generates a new one. The http-request set-header that follows it inserts the identifier into the X-Amzn-Trace-Id header as the Root field.
| unique-id-format %{+X}o\ 1-%[date,hex,bytes(8,8),lower]-%[capture.req.hdr(3)] | |
| http-request set-header X-Amzn-Trace-Id Root=%[unique-id,lower] |
Then, we configure the format of the log messages, which will be ingested by rsyslog. We’ve set the delimiter to be a pipe symbol.
| log-format "%ci|%cp|%Ts|%ft|%b|%s|%TR|%Tw|%Tc|%Tr|%Ta|%ST|%B|%CC|%CS|%ts|%ac|%fc|%bc|%sc|%rc|%sq|%bq|%[capture.req.method]|%[capture.req.hdr(0)]|%[capture.req.hdr(1)]://%[capture.req.hdr(2)]%HP|%ID|%[capture.req.hdr(4)]|%[capture.req.hdr(5)]|%[capture.req.hdr(6)]|%[capture.req.hdr(7)]|%[capture.req.hdr(8)]|%[capture.res.hdr(0)]" |
Captured log lines look like this, before being converted to JSON:a
| 192.168.64.1|46876|1557951572|fe_main|be_servers|s1|0|0|0|1|1|200|822|-|-|--|1|1|0|1|0|0|0|GET|Mozilla/5.0 (X11; Linux x86_64) AppleWebKit/537.36 (KHTML, like Gecko) Ubuntu Chromium/73.0.3683.86 Chrome/73.0.3683.86 Safari/537.36|http://localhost:8080/|1-5cdc7454-67119dff53f9270c0044df8b|667170f54e7ef382|7f59ddcf6e001372|558034ce7f64d663|7788ecb50abfb8e0|148d9bbe6cb5ea07|719 |
Note that %ID returns the unique identifier used as the trace ID. If you like, you can remove the temporary headers that were set before forwarding the request to the backend. Use the http-request del-header directive:
| http-request del-header X-Scheme | |
| http-request del-header X-TraceId | |
| http-request del-header X-SegmentId1 |
In your backend, you should have a server that points to the public IP address of your proxied service, the value of ElasticBeanstalkEnvironmentURL, from the sample X-Ray application that you set up at the beginning of this tutorial.
The final result
Once everything is installed and configured, start sending requests to your HAProxy frontend. Then, head over to the AWS console and see the X-Ray service map, noting that it includes HAProxy! Traces will show load balancer metrics including server response time, time queued, server connect time and client request time.
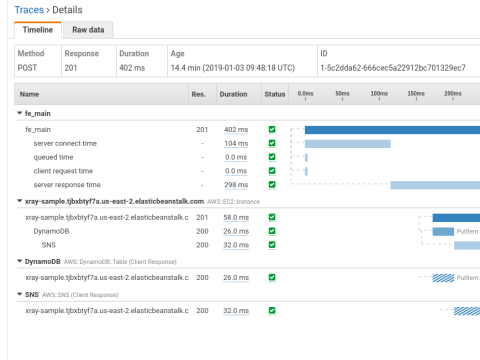
View the traces
Conclusion
In this blog post, you learned how the AWS X-Ray service allows you to create distributed traces that help with troubleshooting, assessing service utilization, and zeroing in on latency. Oftentimes, the HAProxy load balancer is used in AWS because of its advanced features and flexibility. With this solution, you’re able to integrate HAProxy with X-Ray, giving you a richer state of observability.
Want to stay in the loop on similar topics? Subscribe to this blog! You can also follow us on Twitter and join the conversation on Slack. Want to learn more about HAProxy Enterprise? It provides the utmost performance, reliability, and security at any scale and in any environment. It comes with the Real-time Dashboard, which provides added observability across your HAProxy cluster. Request a free trial today or contact us to learn more!
Subscribe to our blog. Get the latest release updates, tutorials, and deep-dives from HAProxy experts.