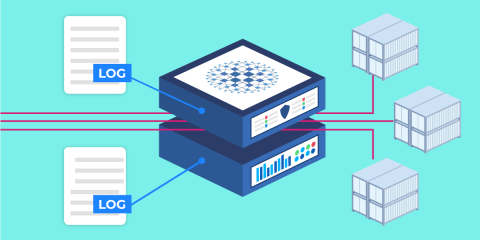
The HAProxy Kubernetes Ingress Controller publishes two sets of logs: the ingress controller logs and the HAProxy access logs.
After you install the HAProxy Kubernetes Ingress Controller, logging jumps to mind as one of the first features to configure. Logs will tell you whether the controller has started up correctly and which version of the controller you’re running, and they will assist in pinpointing any user experience issues. Getting access to HAProxy’s verbose access logs will pay big dividends, but it requires a small amount of setup.
Putting aside the fact that the ingress controller may be deployed as one or many containers across your cluster—either as a ReplicaSet or a DaemonSet—conceptually, it is a single program. All of its components are neatly packaged inside a Docker image. However, inside that image, there are two distinct parts: The ingress controller process and the HAProxy load balancer.
The controller part handles watching the cluster for changes to pods, secrets, and other types of Kubernetes objects. When it detects a change, it triggers an update to the adjacent HAProxy load balancer configuration. The HAProxy part handles routing, TLS encryption, rate limiting, and other proxy tasks. Because there are two parts, there are two sources of log messages.
In this blog post, you will learn how to configure your controller logs and HAProxy access logs. We’ll also consider a few special cases, such as how to capture information about request rates and TLS sessions.
Ingress Controller Logs
Ingress controller logs are what you see right after installing the ingress controller. If you call kubectl logs with the name of one of the ingress controller pods, you’ll see important information about the startup such as the controller version, ConfigMap values, default TLS certificate, etc.
| $ kubectl logs haproxy-kubernetes-ingress-6bbb4f9f5f-lt8j | |
| 2021/02/03 17:19:42 HAProxy Ingress Controller v1.5.0 a5e81ae | |
| 2021/02/03 17:19:42 Build from: git@github.com:haproxytech/kubernetes-ingress.git | |
| 2021/02/03 17:19:42 Build date: 2021-01-21T10:15:17 | |
| 2021/02/03 17:19:42 ConfigMap: default/haproxy-kubernetes-ingress | |
| 2021/02/03 17:19:42 Ingress class: | |
| 2021/02/03 17:19:42 Publish service: | |
| 2021/02/03 17:19:42 Default backend service: default/haproxy-kubernetes-ingress-default-backend | |
| 2021/02/03 17:19:42 Default ssl certificate: default/haproxy-kubernetes-ingress-default-cert | |
| 2021/02/03 17:19:42 Frontend HTTP listening on: 0.0.0.0:80 | |
| 2021/02/03 17:19:42 Frontend HTTPS listening on: 0.0.0.0:443 | |
| 2021/02/03 17:19:42 Controller sync period: 5s |
Then, at runtime, more information will be logged depending on the log verbosity level, which you can set with the --log controller argument to one of error, warning, info, debug or trace. It defaults to info, which, in addition to capturing errors and warnings, reports important changes like updating default options and reloading HAProxy. To change this, you must set it during installation, as shown below, where we set the log level to debug:
| $ helm install haproxy haproxytech/kubernetes-ingress \ | |
| --set controller.logging.level=debug |
Debug logs give detailed information about what the controller is doing. Trace level logs will log, on top of that, all Kubernetes events that the controller receives.
HAProxy Logs
HAProxy emits a different set of log messages that contain a wealth of information, which can aid in identifying trends and spotting anomalies in your traffic. HAProxy access logs can be configured via the following annotations:
Annotation | Description |
Configures one or more Syslog servers where logs should be sent. | |
Sets the default log format string. | |
Skips logging of connections that send no data, which can happen with monitoring systems. | |
Logs request and response data as soon as the server returns a complete set of HTTP response headers instead of waiting for the response to finish sending all data. |
Until you’ve configured the syslog-server annotation, you will not see access logs. In the next section, you’ll learn how.
Setting the log target
To set up your access logs, create or update the controller’s ConfigMap. Be sure to give it the same namespace and name as shown in the startup logs (e.g. default/haproxy-kubernetes-ingress). Below, we set the syslog-server annotation in a ConfigMap definition:
| apiVersion: v1 | |
| kind: ConfigMap | |
| metadata: | |
| name: haproxy-kubernetes-ingress | |
| namespace: default | |
| data: | |
| syslog-server: "address:stdout, format: raw, facility:daemon" |
Then, we apply it with kubectl:
| $ kubectl apply -f configmap.yaml |
If you deploy the ingress controller using the Helm chart, you can set these values during installation, as shown:
| $ helm install haproxy haproxytech/kubernetes-ingress \ | |
| --set controller.logging.level=debug \ | |
| --set controller.logging.traffic.address=stdout \ | |
| --set controller.logging.traffic.format=raw \ | |
| --set controller.logging.traffic.facility=daemon |
To send logs to stdout, use this value:
| syslog-server: "address:stdout, format: raw, facility:daemon" |
Then, you can see the log messages by calling kubectl logs -f <controller-pod>. This is useful for quick setups, proofs of concept, debugging, and other ad hoc situations. However, for a production environment, log retention and collection are important considerations to keep in mind.
One way to make that possible is to configure a logging driver that redirects the log stream from stdout to a target, such as to a file. According to the Kubernetes Logging Architecture guide, the container engine (i.e. Docker) is responsible for redirecting container logs:
Everything a containerized application writes to stdout and stderr is handled and redirected somewhere by a container engine. For example, the Docker container engine redirects those two streams to a logging driver, which is configured in Kubernetes to write to a file in JSON format.
In the case of the Docker container engine, log retention can be set via the log-opt param in Docker’s daemon.json file. However, making changes to the underlying container engine on each node in a Kubernetes cluster is not everyone’s preference.
Another option exists. You can send HAProxy’s access logs to a syslog server simply by using a different value for the syslog-server annotation. That server could be a sidecar container that listens on the loopback address, in which case you’d set the annotation like this:
| syslog-server: "address:127.0.0.1, facility:local0" |
Or the syslog server may be deployed as a separate Kubernetes service that receives logs from multiple ingress controller pods and aggregates them. In that case, set the annotation like this:
| syslog-server: "address: syslog.monitoring.svc.cluster.local, facility:local0" |
The log format
HAProxy’s log format string defines what HAProxy will log. The default value is the HTTP log format, which generates a line that looks like this:
| 10.244.0.1:5793 [10/Apr/2020:10:32:50.132] https~ test-echo1-8080/SRV_TFW8V 0/0/1/2/3 200 653 - - ---- 1/1/0/0/0 0/0 "GET test.k8s.local/ HTTP/2.0 |
Read our blog post Introduction to HAProxy Logging, to learn more about each of these fields. To change the format, set the log-format annotation.
Note that when using TLS passthrough HAProxy won’t do layer 7 inspection but passes TLS traffic directly to backends in mode TCP. In this case, the controller will use a TCP log format string where it also records the SNI value of a TLS connection.
Log custom information
In addition to being able to change the default log format to record different information, you can use the request-capture annotation in your Ingress or Service definitions to capture an HAProxy expression. An expression can include fetch methods and converters.
Here are some expressions:
hdr(foo),lower– returns the content of the foo header converted to lowercase.req.body_param(foo)– returns the foo parameter from the URL-encoded body of a POST request.req.ssl_sni– returns the value of the SNI extension.
A simple use case of request-capture is logging specific HTTP headers. For example, you might want to capture a header that contains a request ID used for debugging or tracing. In AWS, this would be the X-Amzn-Trace-Id header. In this case, the request-capture annotation value would be:
| apiVersion: v1 | |
| kind: ConfigMap | |
| metadata: | |
| name: haproxy-kubernetes-ingress | |
| namespace: default | |
| data: | |
| request-capture: hdr(X-Amzn-Trace-Id) |
This will provide a logline like this, where the Trace ID is Root=1-5e9df9d4-ca09fd0867923f2862d8504a:
| 10.13.19.44:10550 [10/Oct/2020:19:36:52.985] http default-service-log-statsd-haproxy-http/SRV_REhnI 0/0/0/-1/2 -1 0 - - SD-- 8/8/0/0/0 0/0 {Root=1-5e9df9d4-ca09fd0867923f2862d8504a} "HEAD stats.staging.example.com/check HTTP/1.1" |
This can be handy when you need to cross-reference logs of different components that a request trace passes through. Another example is logging the Authorization header to see what type of authorization an HTTP request used:
| apiVersion: v1 | |
| kind: ConfigMap | |
| metadata: | |
| name: haproxy-kubernetes-ingress | |
| namespace: default | |
| data: | |
| request-capture: hdr(Authorization),field(1," ") |
A more advanced use case for request-capture would be to log the number of requests per second originating from a given source IP address after you’ve enabled rate limiting with the rate-limit-requests annotation. When you enable rate limiting, a stick table that tracks the request rate per client is created in HAProxy. The stick table is always given a conventional name of RateLimit-<rate limit period>. The default period for rate limiting is one second (1000 milliseconds), thus, the stick table is named RateLimit-1000.
In the following example, we capture the requests rate by using the sc0_http_req_rate fetch method with the name of the stick table as a parameter:
| apiVersion: v1 | |
| kind: ConfigMap | |
| metadata: | |
| name: haproxy-kubernetes-ingress | |
| namespace: default | |
| data: | |
| rate-limit-requests: 5 | |
| request-capture: sc0_http_req_rate(RateLimit-1000) |
This will provide access logs that look like the following, where the rate per second is shown in curly braces:
| 10.244.1.1:27774 [10/Oct/2020:14:11:06.216] http echo-http-8080/SRV_GWfOI 0/0/0/0/0 200 656 - - ---- 1/1/0/0/0 0/0 {1} "GET echo-1.k8s.local/ HTTP/1.1" | |
| [....] | |
| 10.244.1.1:4415 [10/Oct/2020:14:11:06.264] http echo-http-8080/SRV_VHnHJ 0/0/0/0/0 200 656 - - ---- 1/1/0/0/0 0/0 {5} "GET echo-1.k8s.local/ HTTP/1.1" | |
| 2172.18.0.2:7523 [10/Oct/2020:14:11:06.275] http http/<NOSRV> 0/-1/-1/-1/0 403 212 - - PR-- 1/1/0/0/0 0/0 {} "GET echo-1.k8s.local/ HTTP/1.1" |
Available sample fetches cover more than the HTTP layer. For example, if the ingress controller has TLS enabled, you can log TLS information such as whether the TLS session is new or resumed, whether a client certificate was used, and the name of the TLS cipher negotiated for the connection. The following example shows a request-capture with those fields:
| apiVersion: v1 | |
| kind: ConfigMap | |
| metadata: | |
| name: haproxy-kubernetes-ingress | |
| namespace: default | |
| data: | |
| request-capture: | | |
| ssl_fc_is_resumed | |
| ssl_c_s_dn | |
| ssl_fc_cipher |
The log output looks like this, where the respective values are 0, no value, and TLS_AES_256_GCM_SHA384:
| 172.18.0.2:5099 [10/Oct/2020:15:14:08.677] https~ echo-http-8080/SRV_VHnHJ 0/0/0/0/0 200 732 - - ---- 1/1/0/0/0 0/0 {0||TLS_AES_256_GCM_SHA384} "GET echo-1.k8s.local/echo-1 HTTP/2.0" |
Conclusion
The HAProxy Kubernetes Ingress Controller has two sources of logs: the controller and the HAProxy load balancer. Both can be customized. You can set a different verbosity level for the controller logs and define a new log format and target for the HAProxy logs. There’s support for capturing custom information too, such as recording specific HTTP headers, request rates, or TLS fields. With all of these options in hand, you can take advantage of the detailed information only HAProxy offers.
Want to stay up to date on similar topics? Subscribe to our blog! You can also follow us on Twitter and join the conversation on Slack.
Subscribe to our blog. Get the latest release updates, tutorials, and deep-dives from HAProxy experts.