Metrics are only as valuable as how they are used. At Roblox, we use metrics to help inform decisions every day. With busy sites with thousands of backends the HAProxy Prometheus endpoint produces an insane amount of metrics, so we have had to come up with interesting ways to capture relevant data to show the need to process that much information. During the talk, we will discuss some of the methods and implementations of data processing and analysis and share some tips so you can prove the value of MORE metrics.
Slide Deck
Here you can view the slides used in this presentation if you’d like a quick overview of what was shown during the talk.
Transcript

Hi, my name is Adam Mills, I'm a principal site reliability engineer at Roblox, and I'm here to talk to you today about how Roblox uses metrics to make data-informed decisions. But before I get started, I want to tell you a little bit about myself. I'm a husband and father. I have four kids, two dogs, and 19 chickens. I currently occupy the position at ROBLOX. I've been there for five years. I do load balancing using HAProxy and other load balancing technologies. Before that, I was a network engineer, using routers and switches to help route traffic inside of our data centers, and I'm a huge proponent of using Ansible to automate small workloads.

But today, I want to tell you guys something you probably are already aware of: that outages are really stressful, and every time that there's an outage, the question is, is it the network? But we all know it's probably the DNS that's causing the issue. However, as you're going through your metrics, you're going to slowly discover that there is no log or metric that's going to indicate that it's actually not the network. So the question always is, what if it is the network? How do I prove that, and what information can I use to determine or indicate that the network is not the cause of the outage? And the answer is always going to be more metrics because proving the negative is impossible.

I'm going to show you today how we've added metrics to our catalog of metrics to be able to help our users and developers understand what's going on with their applications from the perspective of load balancing and DNS.
I'm going to show you today how we've added metrics to our catalog of metrics to be able to help our users and developers understand what's going on with their applications from the perspective of load balancing and DNS.

Today I'm going to use an analogy of a game called Uno. Now, I will admit that as I found this picture, it was a little awkward way of playing Uno. They have the cards facing the wrong way, but it's a pretty good illustration. You can actually see that the colors. If you're not familiar with Uno, the game is a matching game of colors and numbers. There are some fun cards in there that make things a little bit more interesting: reverses, skips, draw twos. A wild will actually allow the user or the player to change the color, but the most powerful and elusive card is the draw four wild, which will make the next user in play have to draw four cards.
Now I'm going to use this analogy today, but I don't want you to feel like I'm trying to be adversarial to anybody on our team. For me, playing games is really important. It helps educate people; it helps keep people together. But in this particular example, the way that I'm going to be using it is that the point of the game is to finish. The point of the outage is you want it to be done. You don't want to have to deal with that stress anymore, so being able to quickly, as quickly as possible, go through a game of Uno is really fun. Nobody wants to play Uno for hours on end because it gets even more stressful and compounding as time goes on. And as a disclaimer, please do not play Uno in the middle of an outage.

So how do we stack the deck in our favor? HAProxy has a Prometheus endpoint with a wealth of knowledge. It's easy to scrape and get that data. We're going to talk today about how we aggregate some of the metrics. HAProxy's metric endpoint is extremely accessible, but it doesn't have everything that helps us at Roblox indicate whether load balancing is causing issues because, like I said, the network is never going to report that it's not the problem. Sometimes you need other sources of metrics to be able to determine and with a asurety say that it's not the network. So we're going to tie in other metrics. We're going to talk about how we gather client telemetry to be able to indicate that it's not the network. We're going to talk about how we use logs to help inform that decision. And then I'm going to show you a little bit of the homegrown tools that we're using at ROBLOX to help prove that it is not load balancing or HAProxy that's causing the issue. And at the very end, I'm going to go over some performance evaluations that we actually took to prove that HAProxy is one of the fastest reverse proxies on the market. And that way, as you can see, this hand right now, opposed to the last one, would be a lot of fun to play, and it would put us at an advantage in any outage.
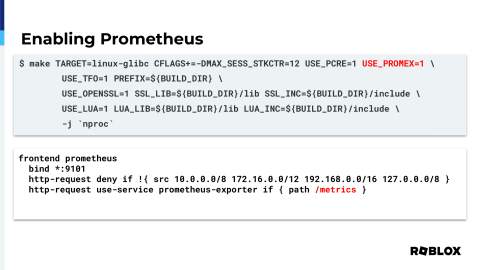
Enabling Prometheus on HAProxy is very simple. Simply, when you add USE_PROMEX=1 in your build statement, this is the one that we actually use at ROBLOX. It'll actually enable that by default. The next step is you actually just need to put on any of your endpoints, whether it be a front end or a listener, the actual use-service, and that way Prometheus is then exposed on this last metrics endpoint, which is the default scraping method for Prometheus.
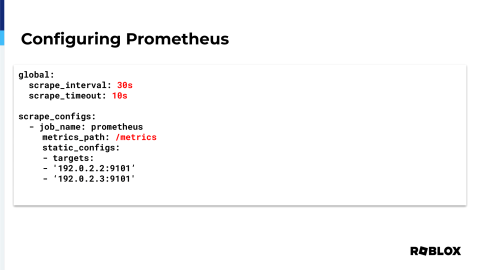
Here's just a really quick example of two HAProxy instances that are configured that have their metric settings points exposed. The scrape interval is 30 seconds, meaning that every time that you're scraping the endpoint, you're going to do that about two times in a minute. And timing out, potentially, if you have long scrapes or if the distance is far away, you might want to adjust that accordingly.

Now this, though the IP has been changed to protect the innocent, is an actual scrape of one of the HAProxy instances that we have in one of our data centers. It is, at any given time, scraping almost 55 megs of data. Every 30 seconds, it's scraping that much information. If you extrapolate that across an entire day, it equates to about 158 gigs of information every single day that's being generated by that one HAProxy instance.
Now imagine you have over a thousand devices. What's the solution? Do we drop metrics? Do we make things less informative? Because when you drop metrics, you're just removing information that could potentially help you in an outage. You could also decrease the polling time. You could go from 30 seconds to 60 seconds or even longer. The metrics won't really change during that time, but your fidelity of the issue will actually decrease the longer your polls are. Then the final answer is just to create bigger disks.
Now imagine you have over a thousand devices. What's the solution? Do we drop metrics? Do we make things less informative? Because when you drop metrics, you're just removing information that could potentially help you in an outage. You could also decrease the polling time. You could go from 30 seconds to 60 seconds or even longer. The metrics won't really change during that time, but your fidelity of the issue will actually decrease the longer your polls are. Then the final answer is just to create bigger disks.
If you need that information, just make the Prometheus instance larger to allow that information to be stored for a long time to be able to see that fidelity and see that information over a given period. But disks cost money, so today I'm going to talk to you about how our metrics help prove why we need to spend more money on metrics and why that's an important investment for us as a team.

Now I don't know if any of these jokes are landing, but I thought this one was pretty good. We were just talking about disks, and now we're going to say volumes. I don't know, hope you guys are having a good time.
I'm going to talk a little bit about the dashboards that we create. First of all, we create operational dashboards. Those are for us as HAProxy users to be able to quickly determine the health and state of our particular application, which is a critical service in any infrastructure to be able to balance client requests to backend servers. However, customers always have the same question: why is load balancing messing with my service? And I think it's important to have dashboards that prove that it's not HAProxy or other load balancing technologies causing issues. So having two distinct dashboards, or multiple distinct dashboards, that help prove that is really valuable. Then this is the most elusive dashboard: it's the high-level dashboard. Now we all know that that's a speak for maybe some management. They want to know, is it up? And that's a really hard metric to determine. Of all the different metrics that exist, is your service working properly?

Now this next one is going to feel like a skip card. Now skip, if you didn't know, when you play that card, it actually goes and makes the next person not have to go. Now in this particular case, I want to be skipped when it comes to alerts and outages. I don't necessarily want to be called if it's not really my problem, so I'm going to show you how you guys can hopefully get the same level of feeling when you guys have your metrics running.

So we use the shed load feature. Now I'm going to talk a little bit later on in this talk about DNS, but needless to say, our DNS provider is NS1. We feed to them, at least initially, a CPU-based load metric for our POPs. When the average reached 60 percent, we wanted NS1 to stop serving the IP at that particular POP to clients, and we wanted to steer them to another location. However, this very rudimentary approach did not factor in our layer 4 load balancing that sits in front of HAProxy. It also didn't talk about any of the other potential metrics. The CPU might be fine, but open sockets for longer-lived connections, for example, if our POPs in Hong Kong and Singapore open up longer connections back to our data center. Therefore, you can't just take one factor to be able to determine the actual load of a data center. So we added multi-factorial. We used packets per second on our layer 4 load balancer as a percentage. We used a percentage of the total sockets available on HAProxy, and of course, we used the average CPU for the given site.
However, we did get paged. I got paged, in fact, for high CPU in our Hong Kong POP, and this is what I woke up to. It was the middle of the night, and it looked like everything was fine. Nothing had breached that blue line, which is when we want things to start moving away, but in fact, we don't even want a page on that because we created this. We got skipped. We didn't have to get paged. The traffic just gracefully moved to another site, so we had the question, why is this particular site alerting?
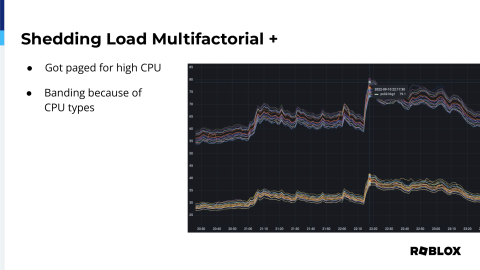
Breaking down the average, what we noticed was banding. We saw these two separate groups of CPU utilization, and what happens when you take a larger and a smaller atom together and divide by the total number, you get the average, which ended up being not helpful. It caused issues. We actually got HAProxies that were running at 80% CPU utilization. We didn't know if it was actually causing an issue. We didn't see any player drops or anything, so good on you HAProxy. However, we didn't want to get into that position again of where it might actually be causing issues of latency.

So we wanted to be able to identify those different types of servers. We have some CPUs that are running hot and some that are running low. So we have node exporter giving us that information of which CPUs and all that information to us. So do we count based on the CPU or do we take the CPU type of node exporter? What we found was that node exporter actually is a pretty cool feature where you can actually stick arbitrary data into a flat file, tell node exporter where that file is, it will slurp it up, and as long as it's Prometheus formatted information, it will actually display it as metrics. So we started to include the manufacturer, we included the rack, the row, the cluster, or the pod that the particular servers are in, and it's as simple as just adding an extra line onto your node exporter command, telling node exporter where those files exist on the system.

At ROBLOX, we use a term called design revision. Design revision for us is a way to indicate to the user what type or what workloads HAProxy is running within our data center or at our POPs. So we have edge nodes, data center nodes, and we actually have HAProxy now scheduled inside Nomad in an orchestrated environment, and we wanted to be able to communicate that information so that we could group those like typed devices together rather than having them based on something else, maybe just the scrape job or whatever. We wanted to be able to indicate that information.
So in one of our files, as you can see, we've included the design revision, but we also have this idea of an image. We run all of our workloads in Docker containers, so being able to indicate when that Docker container was revised or changed will actually give us that information. It'll show to us that when a device changed, we can actually pinpoint if there were any changes elsewhere within the stats to be able to determine if it was the new image or otherwise that was causing the issue. Now since I have HAProxy on the line, this would be a really cool feature for you guys to include in the future, but we have a need to expose to our customers, the people who use load balancing inside of our data center, the types of configuration items or elements that are configured for HAProxy facing their server. So, in this case, what we noticed was there was a lacking metric, which was what load balancing algorithm we're using and if we're using IP hashing for the load balancing algorithm. For some of our applications that are high utilization, they rely on local cache to not obliterate our databases so having this information exposed and easily accessible for our users was super helpful, and if you have any questions, HAProxy, I'll be happy to give them to or give you the answers to them of why we decided to go with this particular method.
Then, the other part of information that we thought might be relevant to a user ingesting the data is what racks the devices are in. Using bare metal infrastructure, there comes, there comes a, I wouldn't necessarily say it's a headache, it's more of an understanding of what types of things can impact the performance of your instances of HAProxy or your other services. One of the things that we noticed was that sometimes when we lose access to a particular power feed inside of a rack, we actually will lose up to 25 or 50 percent of throughput through our instances of HAProxy. Now, it's not HAProxy's fault. That's a power distribution problem, but when we have this information stored and relevant, we can actually see which one of the HAProxies are having issues, and we can group them by rack and see that they're all in the same rack and help us determine that that's the reason why the throughput went down so low.
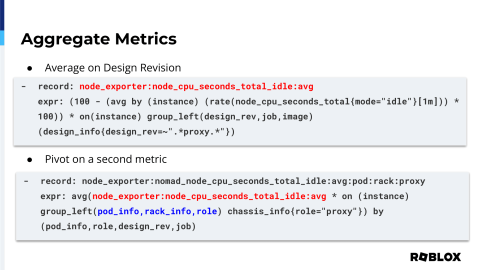
So now that we have that information, we can aggregate the data based on that information to be able to present to a user or a person on the other end what information is relevant. Having the CPU utilization of the first CPU across all of the HAProxies globally provides absolutely no value because the information or players and things that are connecting to HAProxy in Europe are connecting at different times and people in APAC, so even having that average doesn't make any sense. But what we can do is we can aggregate them based on design revision, job, and as I mentioned, the image of the instances of HAProxy. That way, we can actually see as we're doing updates and things what the impact is on those, on that group. Once we have that information of design revision and image and job, we can then pivot and create other aggregations that will provide us more meaningful information, for example, the pod information, the rack information, and even the role of the devices themselves.

So the next card I'm going to talk about is a reverse card. As the play is being played in a circle, if someone hits you with the reverse card, it basically makes play go back the other direction. And the way that I like this is that when you're in a discussion about what's happening inside of or during an outage or during an issue or about troubleshooting, to be able to give the information back to a developer or management that, hey, this is how I know that this is not our problem, that's what I'm going to talk about today. And again, this may feel adversarial, but it's really not. Finding the root cause of an issue is the most important and most critical part of an outage, so giving that information back to the developer will help them find their issue faster and more efficiently.

Now we collect metrics from our client at the edge, although very sparse, and I'll get into how we tried to fill that gap. We have metrics gathering at both layer 4 and layer 7 inside of our edge. Inside of our data center we have the same setup, and then as I mentioned, we have HAProxy running inside of Nomad, which contains a lot of backend servers, and information is churning very rapidly there. But for us, what we wanted to gather, as I mentioned, the client to edge, because that's kind of a place where it almost feels like a black box. See what I did there? We get about 2 million connections per second across all of our infrastructure, which equates to about, at peak, 28 million requests per second.

Now if you're thinking about that, how do I find the one connection or the one player that's having issues? It sounds like, it sounds like a needle in a haystack. We have 22 POPs, and as I mentioned, we outsource our DNS. Now I don't really want to have a discussion of the benefits of using anycast versus unicast routing. Needless to say, we use the unicast routing where each one of our POPs has a distinct IP, and we use DNS to be able to determine the lowest latency for users at a given POP. This gives us a lot of fine-tuned control when it comes to serving players that otherwise we lose when people use anycast. So it is a latency and targeting system that NS1 has provided that has Pulsar. However, pinpointing issues in this system because it is outsourced is very difficult. All of their data is proprietary, and though they have been very open with us on the things they can share, they can't share everything with us. So that client information of why a POP is selected or when a POP is selected is very obtuse to us, so we wanted to create a method where we could gather those metrics ourselves.
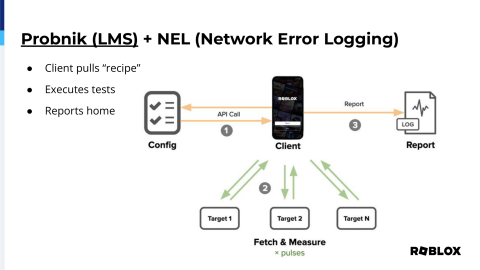
In 2019, Netflix open-sourced a project called Probonic that we use internally. It's called LMS. What this is, is it's a JavaScript application that runs inside of our apps, both on mobile as well as the website, whereas in the mobile app it's actually using Lua code, but what it does is it fetches a recipe from the running service, it executes all the tests against, in this case, three tests, then it reports that information back to a centralized server. So we have that information on hand to be able to help inform us.

It allows us to compare latencies across our different instances. We can compare different network paths as it relates to the clients themselves. It'll allow us to see when we make configuration changes to DNS or otherwise, and it gives us the most important thing, which is TLS settings comparisons, where we can actually see when we make changes if it, what the impact is to the users as a global whole, rather than try to guess from the perspective of HAProxy, because although HAProxy serves 2 million connections per second, if there's a setting that changed on the other side, on the client side, it would be very difficult to determine that from the perspective of HAProxy. We can also check our different transport protocols, specifically the benefits of HTTP 1 versus H2, and then it gives us server statistics and the network availability of particular POPs and endpoints. We can feed all of this data back into NS1, and they can give real-time targeting, basically a shot in the arm. It's going to be so much easier for them to be able to see what's happening within the network and be able to pinpoint and find issues if we have metrics that we're feeding to them that then we can also ingest and display on our side.
The second piece we gather is the network error logging, which is a browser report.

Of course, our clients, our mobile clients, don't have this configured yet. We're working on it, but this allows our browsers to be able to report back to us issues that the browser is having when it's making connections. The reports can contain errors, including TCP, application, or even, you guessed it, DNS, but not all browsers support it.
On the client configuration side, it's as easy as pie with HAProxy. All you got to do is set the header for now, give the information of where you want them to send it, and what success criteria, or what criteria, you want the browser to report, and then the endpoint for where you want them to report it to. We configure it to give us a hundred percent of failure fraction and a little bit of success, and then we just multiply the successes because we really bank on load balancing doing the right thing. So, we're seeing the totality of the errors is really what we're looking for.
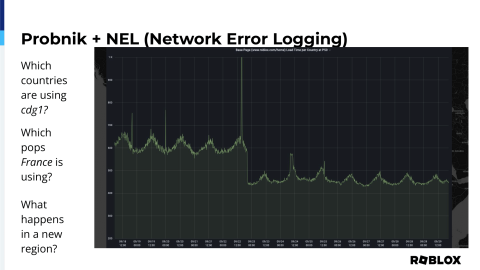
So, what are the results of implementing this on our side? Well, this gives us the granularity to actually see, for our France POP, which countries are actually being targeted to it and in what frequency.
Moreover, when we have players in France, we can determine which POPs that they’re using. Now, we don’t always use latency-based metrics to do our targeting. There’s also a whole suite of matchmaking algorithms that live in the background that help players play with the most success possible. We want players to have a good experience, so if a game is already running, or if their friends are playing someplace else, they might get targeted to another POP, which is why you’ll see other POPs lit up.
And this, although it has nothing to do with France, we actually recently turned on a Sydney POP. This information that we’re getting from Probnik and NEL actually gives us a report card of what happens when we turn on the new POP in Sydney. We saw a huge page load latency decrease. Now, this is the type of thing that you can show to your superiors to be able to prove why targeting is important, why HAProxy is important because this actually shows with finality the impact that putting TCP connections as close to the players as possible benefits them.
Also, as I mentioned, the intent is to reverse the discussion. People want to point the finger at load balancing. With this information, we can actually make the determination: was it one POP or all POPs? In this particular issue, which I pulled up, but it really is not a huge problem, we can see that it happened across a majority of POPs, meaning it probably is not related to one POP or even one region.
The next question is: Was it one country or all countries? Here we can see that there is a smattering of issues, but during that particular time, it happened across a bunch of countries, meaning it might not be something that's within our control or ability to fix, which is also really critical to know. If it’s something on the network, like outside of your data centers or your edge, you’d need to be able to know that and determine that so that, one, you can start engaging correct parties, and two, you don’t have to keep digging in your own logs to try to find that elusive "it’s not my fault" because if it’s not your fault, you’re never going to find that log that says it’s not.
And then you can always answer the question: was it actually DNS?

Interestingly enough, we pulled up this metric for this presentation and we noticed that our application is actually calling a DNS record that doesn't exist anymore. And so this information spurred a conversation on our side: what is that record and how do we turn it off? Because clearly, it's timing out and it's providing no value to the client.

So, now that you have your skips and your reverses, let's talk about tracking that evasive Wild Draw 4. It's a pretty cool card, and what it does is allows you to change the color as well as provide four cards to the next player to keep the game going.

As I mentioned, we have about 2 million connections per second. However, we better have a ratio of about 170 backend connection errors per second. That doesn't seem like a lot when you're talking about 2 million connections, but it still is pretty significant.
We get about 2,000 500 errors. When I was talking about the 28 million requests per second, about 2,000 of them are 500 errors and 160,000 of them are 400 errors. Now you might say, well, those figures don't have anything to do with me. I'm not going to worry about it. But we've wanted to actually prove that when the 500 and 400 errors are coming through, it's not HAProxy and it's not Layer 4 load balancing. And again, that's to help the customer, to help the people that are using load balancing find the actual issues.
So, what we wanted to do is we wanted to actually log the termination state. So, from the perspective of HAProxy, when the connection or request ended, what was the state of that connection? Was it healthy? We know if you've dug through the HAProxy log information that a dash dash state code means it terminated just fine. Everything. So, if you get a 500 error with a dash dash, it means it probably wasn't HAProxy that caused the issue; it was something else.
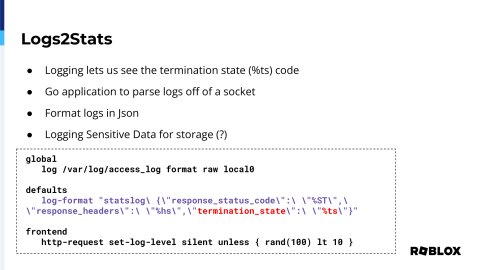
But what we wanted to do is actually get that information out of HAProxy so that we could actually display it and have a metric to go on. So, we can determine if it was the health of HAProxy or something else that's causing the issue. We wrote a little Go application that actually reads the logs off of a socket to be able to determine that information. So, we took our logs, we formatted it as JSON, so when that log comes through it can actually be marshaled and then parsed as a dictionary.
And as we all know, logging sensitive data can be very dangerous. People can provide usernames, information, and even passwords in plain text, even in the URLs. So, sending all of your logs to a centralized server really wasn't an option for us. We have to deal with not only GDPR but COPA as well because kids play our platform, and it's important for us that their information is safe. But we did want to know, when they stopped playing, was it because HAProxy or the application was causing issues? So, with this configuration, we can actually get that information off of a log socket, and 10% sampling is a pretty reasonable amount. We tried at one point to crank it up to 100% and that just ate up all the CPUs available, so it wasn't cost-effective. But having a 10% sampling gives us enough information to be able to determine whether it's HAProxy or otherwise.

So, here's just an example of a timeframe where we were looking at the rate of errors coming off of the www.roblox.com site that were not dash dash. As I mentioned, dash dash means everything was okay. And in this case, the termination codes that are coming in at about 17 per second, it's CD, that's a client error. So, with that information, we're able to determine that the connections and issues that we're having are almost outside of our control. Now, you could argue that there's stuff that could be done in the application to be able to make it easier and more robust or actually see that information, or you could update your client to be better. Some of that stuff HAProxy can solve. You'll have to work with your developers to figure that out.
Now, across all of our endpoints, you can see that this edge, and because you have to be able to see if you have connections going through an edge to an HAProxy in a data center, you have to have both those legs because even though the connection might have ended in a CD in the data center, the edge might report that as a dash dash. That's not great, right? You need to be able to see that at both layers to be able to determine the health at both layers.
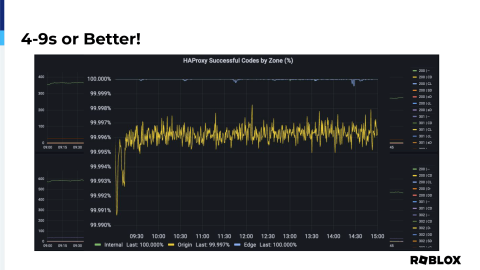
But with that information, we can take the dash dashes and we can subtract them and divide them and do some really cool math that I don't really know how to do. Our data analysts do it, but we're able to determine that we have four nines or better of reliability when it comes to HAProxy. And of course, at the edge, you can see the blue line at the top, it says it's 100%, but as you can see, there are some dips, there are issues that happen. So, it's not an exact perfect metric, but it is enough to be able to show, I mentioned this earlier, one metric that can give you the information that you need to be able to prove that HAProxy is not the cause of the issue.
So, we have part of that done, part of that draw four. We have a lot of really cool information, but I think it's important as engineers that we always re-evaluate our premises. And by that, I mean we make a decision, maybe in the past, maybe four or five years ago. You need to be able to reevaluate. We made a decision to move to HAProxy a few years ago because of a couple of reasons. Performance was one of them, but really the big one was OCSP stapling. There were no other reverse proxies that easily implemented OCSP stapling like HAProxy did. However, Envoy came out with a recent revision that included that functionality, so we wanted to go back to that premise, that the reason we chose it was because of XYZ. So, should we continue to use HAProxy versus the other ones?
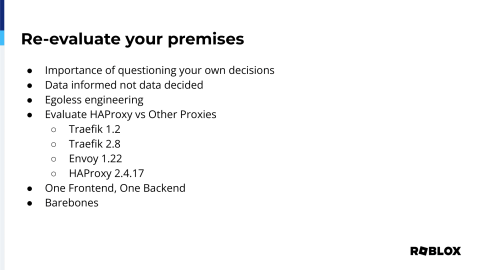
So, we wanted to make that decision based on data, not a hunch, not a market forecast, not somebody else's blog post indicating why. We wanted to make the decision based on information that we gathered for ourselves.
I call this egoless engineering. We may have made a decision before, but we need to take ourselves out of the equation and allow the data to help us make the next decision. Now, I mentioned data-informed at the beginning of my talk. I do feel like there are other things that go into why you make a decision, and it's not just performance. However, that can indicate why you would be making that decision. So, that's just an important distinction.
So, we took HAProxy and we pitted it against three other reverse proxies. We took Traefik 1.2, Traefik 2.8, Envoy 1.22, and of course, HAProxy. We use a Community Edition currently inside of our data center at our edges, and we're going to be doing a very similar evaluation with the Enterprise Suite.
But we pitted all those things against each other, and our results were pretty staggering. We wanted to make sure that we gave everybody a fair chance, so we configured one frontend, one backend. We used the same server for each of the configuration items, but we used the bare-bones config. We didn't want to try to optimize for anything. We just wanted the stock straight out of the dealer's showroom to find out which one of these was the best.

The first test we did was just HTTPS. As I mentioned, one frontend, one backend, and we used bare-bones config. Our harness was K6, and we just ran it against a counting Docker container that exists on the internet. The throughput for HAProxy was significantly higher than any of the other reverse proxies on the market. And when it came to latency across those tests, HAProxy just beat everybody. Envoy was really close, but it had, there's much to be gained there. And the performance for gRPC was very similar, where Envoy is getting up there, it's really close to HAProxy. However, a majority of our requests currently within our data center and at our edge are HTTP or HTTPS. So, choosing Envoy just didn't make a whole lot of sense from that perspective, and there might be a reason that's outside of performance why you would choose another reverse proxy. And I don't want to necessarily dictate why you should or shouldn't select any reverse proxy, but it's clear through our testing that HAProxy was the most performant.

So, we've now stacked the deck. We have Skips, Reverses, Wilds, Drop Fours. We've shown that metrics are critical for infrastructure to be able to prove, without a shadow of a doubt, that it's not the network. These are that log, that elusive log that's not going to show to the network, it's the immensity of data that's being able to be provided to show that it's not our application. Because most times, if there is an issue, the developers or the users are coming with receipts: "Hey, I've got connection issues. If there's a connection timeout and I'm trying to reach HAProxy, then clearly it's the reverse proxy." But now that we have those metrics, we can help guide our players, guide our users to that inevitable end of game. Nobody wants to be playing Uno forever. It's just not fun that way. You want to be able to get everybody to the end as quickly as possible because you're going to have to start a new one tomorrow.

Here's some links for all of the information that I provided today, with the last one being, if you have any desires to want to help with this project of Log to Stats, please reach out on our careers page.
We're hiring people all the time. We're looking for DNS and reverse proxy engineers to help grow our player base and make things more reliable, and we always like to hire people who are passionate about metrics and making things better for players.
So, thank you very much. It's been a pleasure. I appreciate HAProxy granting me the opportunity to speak to you today, and I hope you enjoyed my presentation.
Great. A huge thank you to Adam. And now, I really want to play Uno. I don't think I've played in about 15 years.
So, we do have Adam, or should have Adam, joining us live. Hopefully, he should appear much larger than everybody else.
Hello.
I think the volume should be good. Are you able to hear me, Adam?
Yes, I am.
Excellent, okay, great. And I love the mustache adjustment as well.
Yeah, no problem. And playing Uno, maybe play Roblox. I don't know.
That's true. My kids will have me playing that soon enough.
Great. So, again, we are taking live questions here, so if you have a question, just raise your hand in the audience and one of our mic runners will come around to you. And we're also, for everyone online, we are taking questions in the stream chat. Our team will look out for those, as well as on Twitter with hashtag #HAProxyConf. So, we did have a couple of questions come in during the presentation.
Okay, so the first one for you, Adam: Even with tons of data and beautiful graphs, there's still a human being sitting in front of it all, interpreting and making sense of it. Do you have any thoughts to share around how to grow the next generation of site reliability engineers?
That's a really good question.
I mentioned at the end of my talk that I think it's important for people that are passionate about metrics. I think observability, coming from a network engineering perspective, observability at the application layer is super important. And I think just having people being able to, once an outage has happened, walk through the outage as a team, understand how things could have been better, and find those elusive metrics. The dashboards that we have are great and awesome, I appreciate them, I built some of them, team members have as well. But I think just an understanding, a holistic view as a team as to what happens during outages, would probably help the junior engineers catch up a little bit faster.
Excellent, thank you.
One more question in the chat. So, this is in relation to your describing cultivating a decision-informed mindset. So, the question is, if you're just starting out thinking about this decision-informed mindset, what's the first step?
I think it's, what metrics are important? If you go into the Prometheus endpoint for HAProxy, I was not exaggerating, there's literally thousands of metrics that may or may not provide value for you and your infrastructure. I think understanding which of those metrics is important and which ones, when you turn the knob in one direction or another, how that's impacted. So, if you're starting off fresh, understanding what's available to you and understanding what, again, how, when you start turning things, turning DNS, turning CPU, cranking things up or down and being able to observe that is super critical. And once you have that information, I spoke about it too, you have the data first and then you make the decision later. You never, you don't do it in the reverse.
The next question is related to metric retention. So, what level of metric retention did you settle on and do you use central storage like Cortex or Mimir?
We are currently in the process of moving our infrastructure. So, we were just doing Prometheus in AWS, and our observability team noticed how awesome our metrics pipeline was. They decided not to use Prometheus exactly, they went with a flavor of VictoriaMetrics using VMs in AWS, and we're using the Grafana agent locally, and we're slowly porting all of our information there. Our long-term retention for the very critical systems, we have a three-month retention, and for the long-term storage, we're still in discussions of however we're going to do that, but Cortex seems like the direction we're going to head.
Great, okay, that's all the time that we have for questions for Adam. Once again, Adam, thank you so much for putting the talk together and for joining us live. Another big hand for Adam.


