
In this presentation, Daniel Schneller gives insight into how CenterDevice uses HAProxy to protect backend servers from malicious users and log information that is vital during troubleshooting. CenterDevice uses HAProxy ACLs to classify unwanted traffic, including vulnerability scanners and spam bots, and then HAProxy deny rules to filter traffic. HAProxy gives them detailed logs and metrics, which they visualize using Grafana, Elasticsearch and Kibana. They also use its DNS service discovery feature to automatically configure load balancing to their servers.

Transcript
Hello everyone! I hope you’ve had a nice lunch and are now interested to hear how we use HAProxy at CenterDevice as our doorman, keeping unwanted stuff out and gathering some interesting statistics along the way. My name is Daniel, as you have heard, and this is just an overview of what I’m going to talk about today. First a few words about who we are as a company and what we do, followed by a quick outline of an architecture of the stack, and then we’ll be diving right into some of the HAProxy configuration examples, how we generate them, before drawing some conclusions.
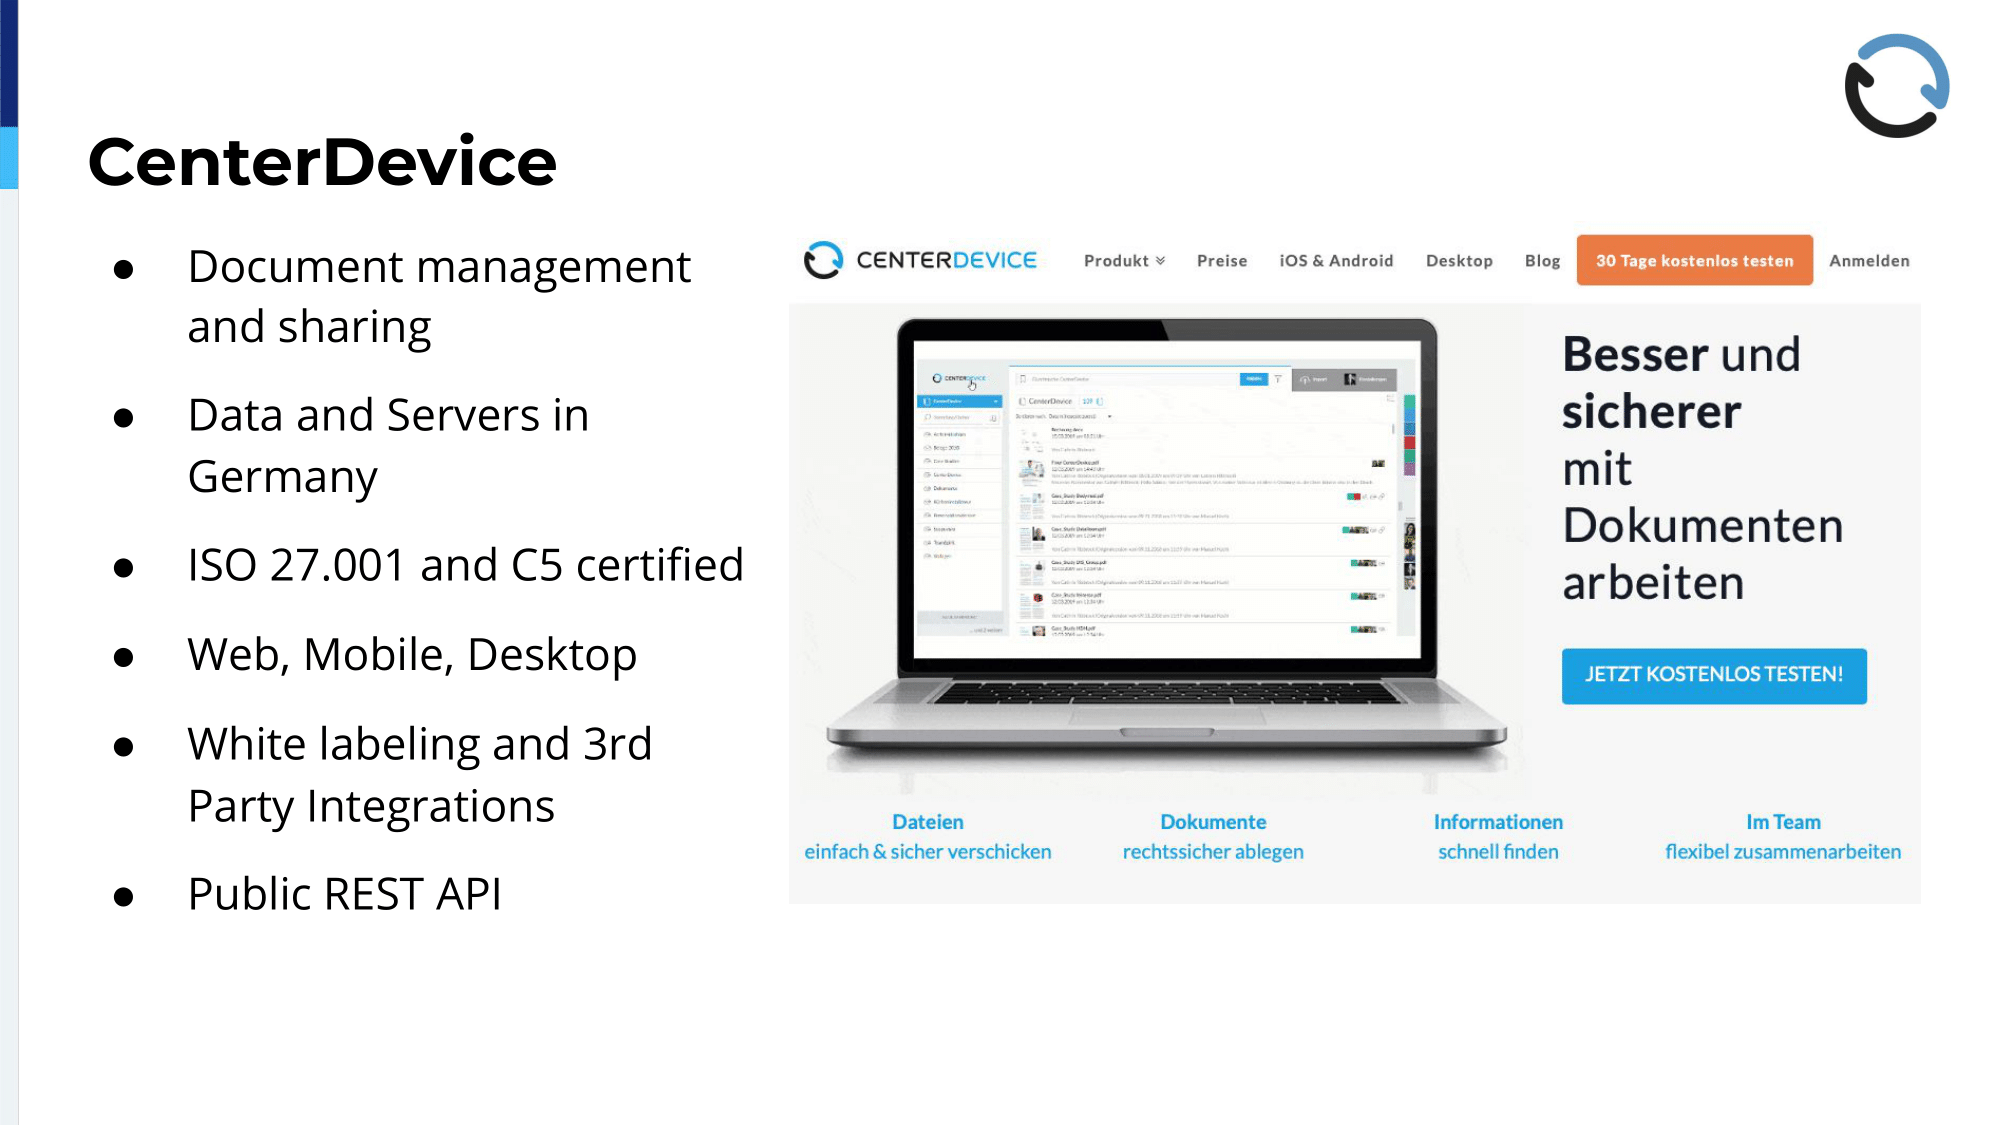
So, who are we, what do we do? CenterDevice is a document management and sharing solution. It’s a cloud-based offering and the company was founded, and is still run by, a quite small group of software developers and engineers, and because we’re such a small team we must rely heavily on automation just to keep things running and maintainable because we’re just not enough people to do things manually. HAProxy is an important component in that, we’re using it across the whole stack; It’s basically installed on nearly every server, every instance that we have, doing something or other for us. This talk focuses on how we use HAProxy to operate the public part, the public REST API that we offer, and how we protect it and gain insight into the traffic that goes through that REST API.
The REST API is used by our own software, that means the Windows client, the MacOS client, but also the web application that we have, the mobile clients, but also by third-party integrators. So, we offer you to integrate CenterDevice as a backend into your own software stack or resell it as a white labeled solution, slap your own logo on it and color scheme and so forth, but everything goes through that same public REST API. There is just a very small private part for billing and other things that we need to do on top of that, but apart from that, it’s all the same for everyone, including ourselves, so we are eating our own dog food there.
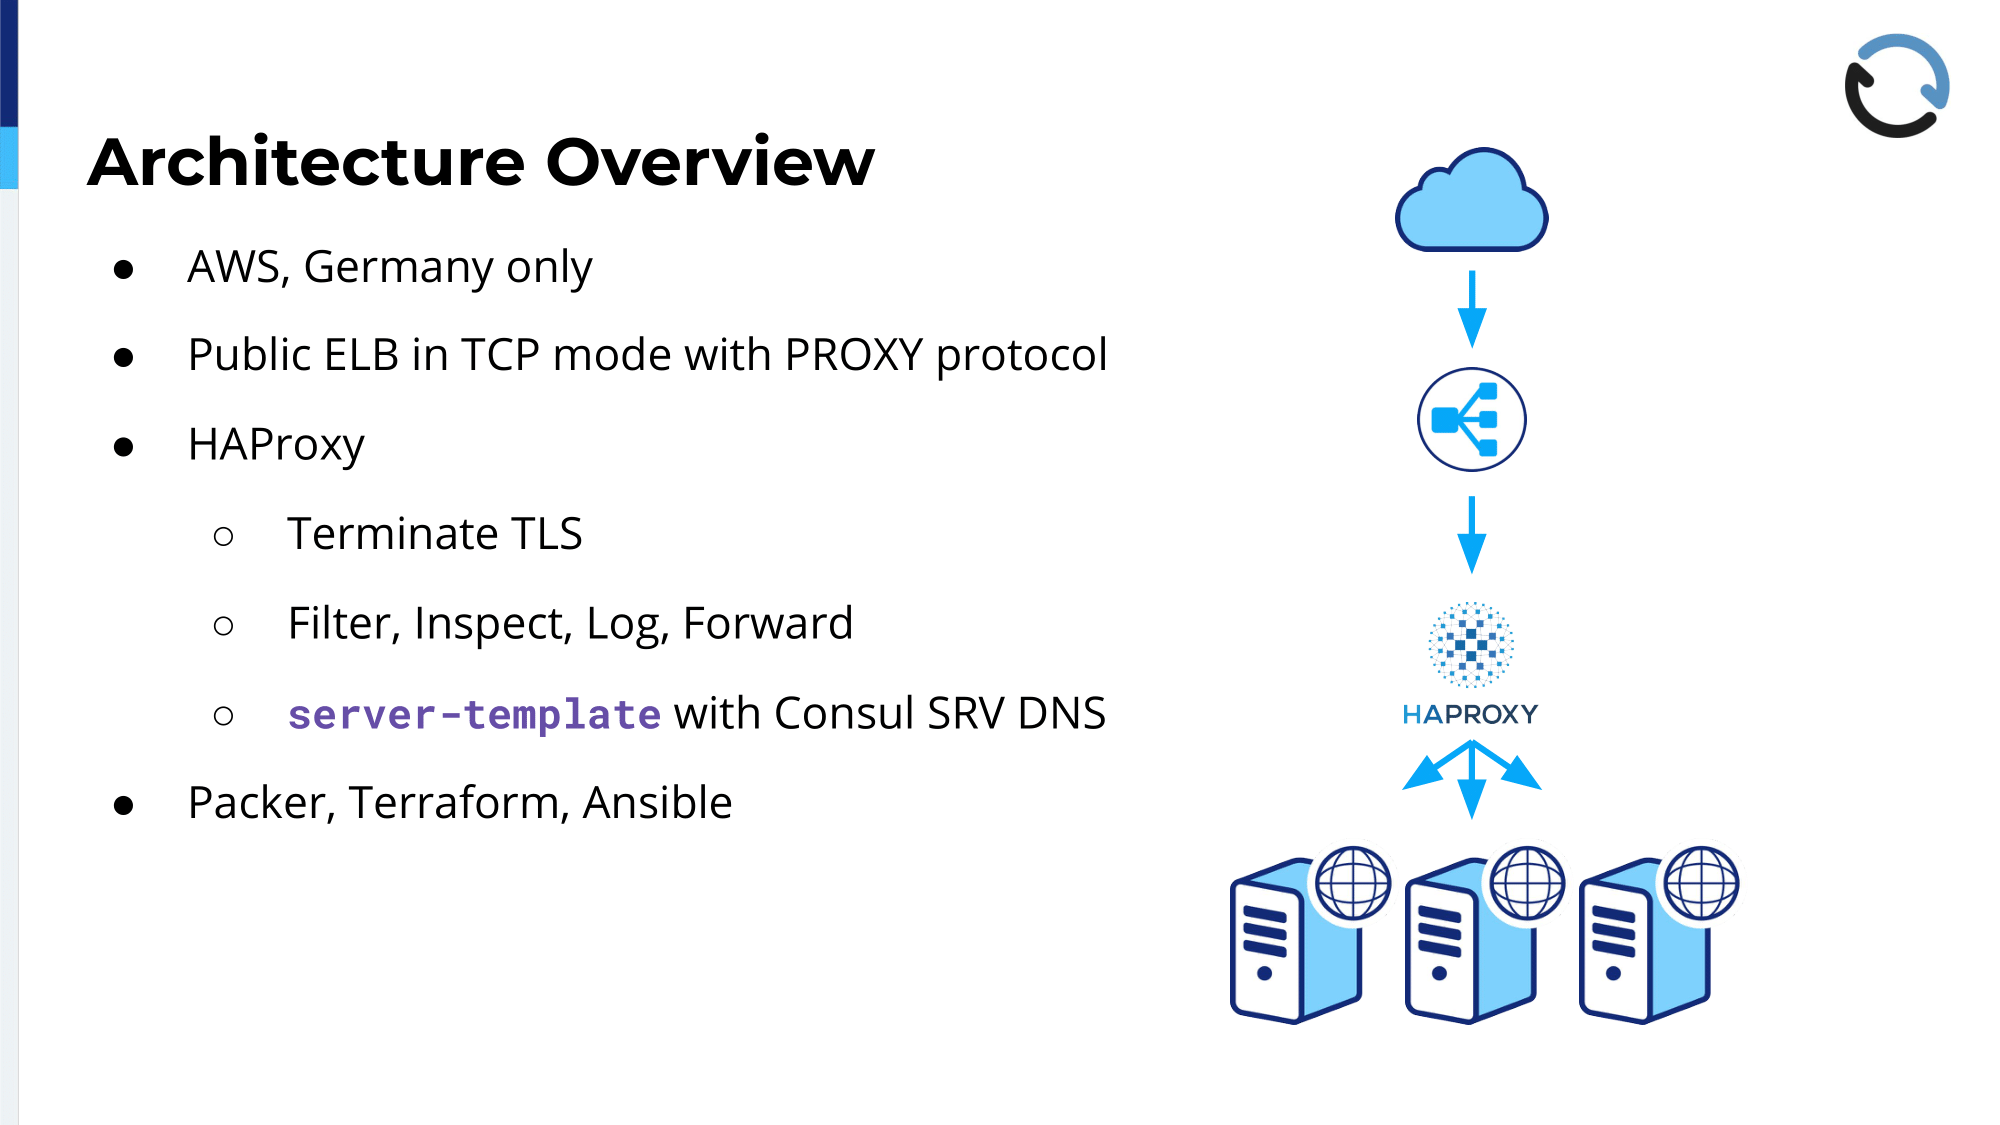
How it’s built: That’s just going to be a very quick overview because it’s not a complex system, at least not for that part that we’re talking about today. We are hosted on AWS in the EU Central region, so that is Frankfurt, Germany. That is something that we promised our customers to do and to stay in Germany with all the data and all the servers; and as we heard earlier, we have a similar setup, we have an Elastic Load Balancer, the AWS ELB at the outside facing the Internet, but that is configured to be in TCP mode. So, it basically just passes stuff through to us; That is mostly done for reasons of resiliency, so that if the VM dies, which happens sometimes—yesterday—and then a new one can be spun up and from the outside you hopefully don’t really notice. Also, it allows us to do rolling upgrades because then we just spin up a new one and once traffic has shifted over, we tear down the old one.
The ELB is configured to use the Proxy Protocol, so that answers a question that came up before lunch. That gives us the opportunity to actually see the client IP that the mobile device or the computer that was making the request had instead of just seeing the private IP of the load balancer itself. That is quite useful, and we use it to terminate…we use HAProxy then to terminate TLS, so that’s why we’re just passing the TCP stream through the Elastic Load Balancer. We don’t want to install keys and certificates into the Amazon infrastructure if we can avoid it, so we’re just taking the data as it comes in straight from the client.
The servers in the HAProxy config, those come from Consul; Consul knows in its catalogue which servers are up at the moment, which kinds of backend services are installed where, and then with a server-template based on DNS, HAProxy dynamically knows where to send the traffic and when something goes down, what remains, and something new comes up. That’s pretty flexible and has been working very well, and as I said, automation and infrastructure-as-code, that’s what we do; The whole thing is set up based on Packer for building the images for the computers, Terraform to bring it all up, and Ansible to automate it once it has been deployed and once it is up and running. That will be interesting to see because that’s what we use for the HAProxy configuration too, then.
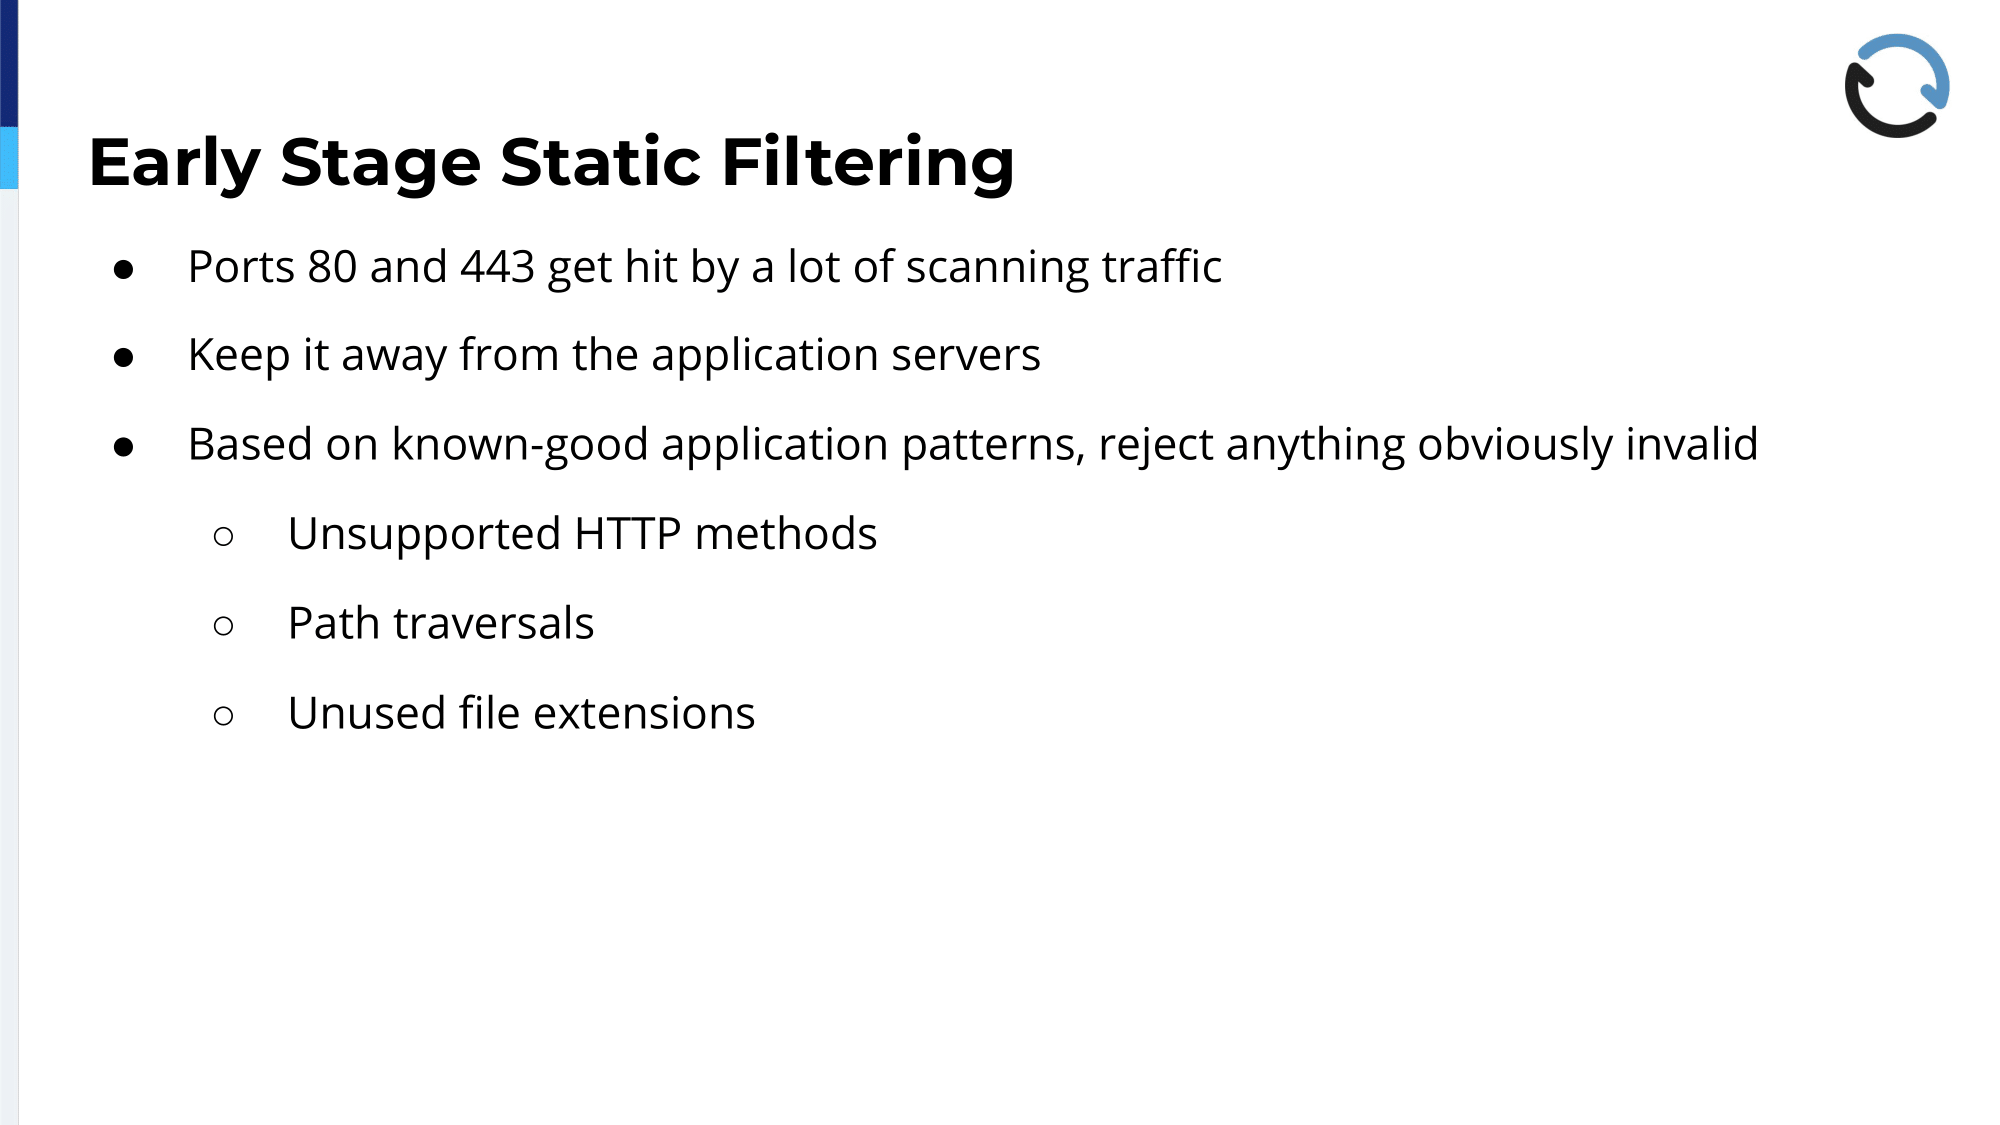
Once you put something on the Internet, as most of you will probably know, it immediately gets hit by a lot of background radiation traffic, all kinds of old viruses and worms that are still living in closets and spamming the Net with their waste; and because the ELB just passes everything right through, all that stuff reaches the public facing HAProxy instance handling the REST API. So, as a first line of defense, we use it to try to pick all the low hanging fruit and get some of that spam away.
In the first stage, we just use quite simple, static, patterns matching stuff that we know isn’t…obviously it’s uninteresting to us because we have a pretty good idea of what regular traffic targeting the API looks like. That keeps all that stuff away from the application servers so we don’t have to worry about them getting hit by all that noise, and as I said because we know what the application expects, in most cases we can reject anything that is obviously invalid. For example, HTTP methods, we don’t support the PATCH method, so there is no need for us to ever have a request with that method reach any of the backend servers.
The same goes for path traversals, for example. We know that at no point in the API we need to move up or down a path, so anything that comes in with a pattern matching that is also obviously invalid for us. Then, the whole backend stuff is all implemented in Java, so we can also weed out unexpected file extensions.
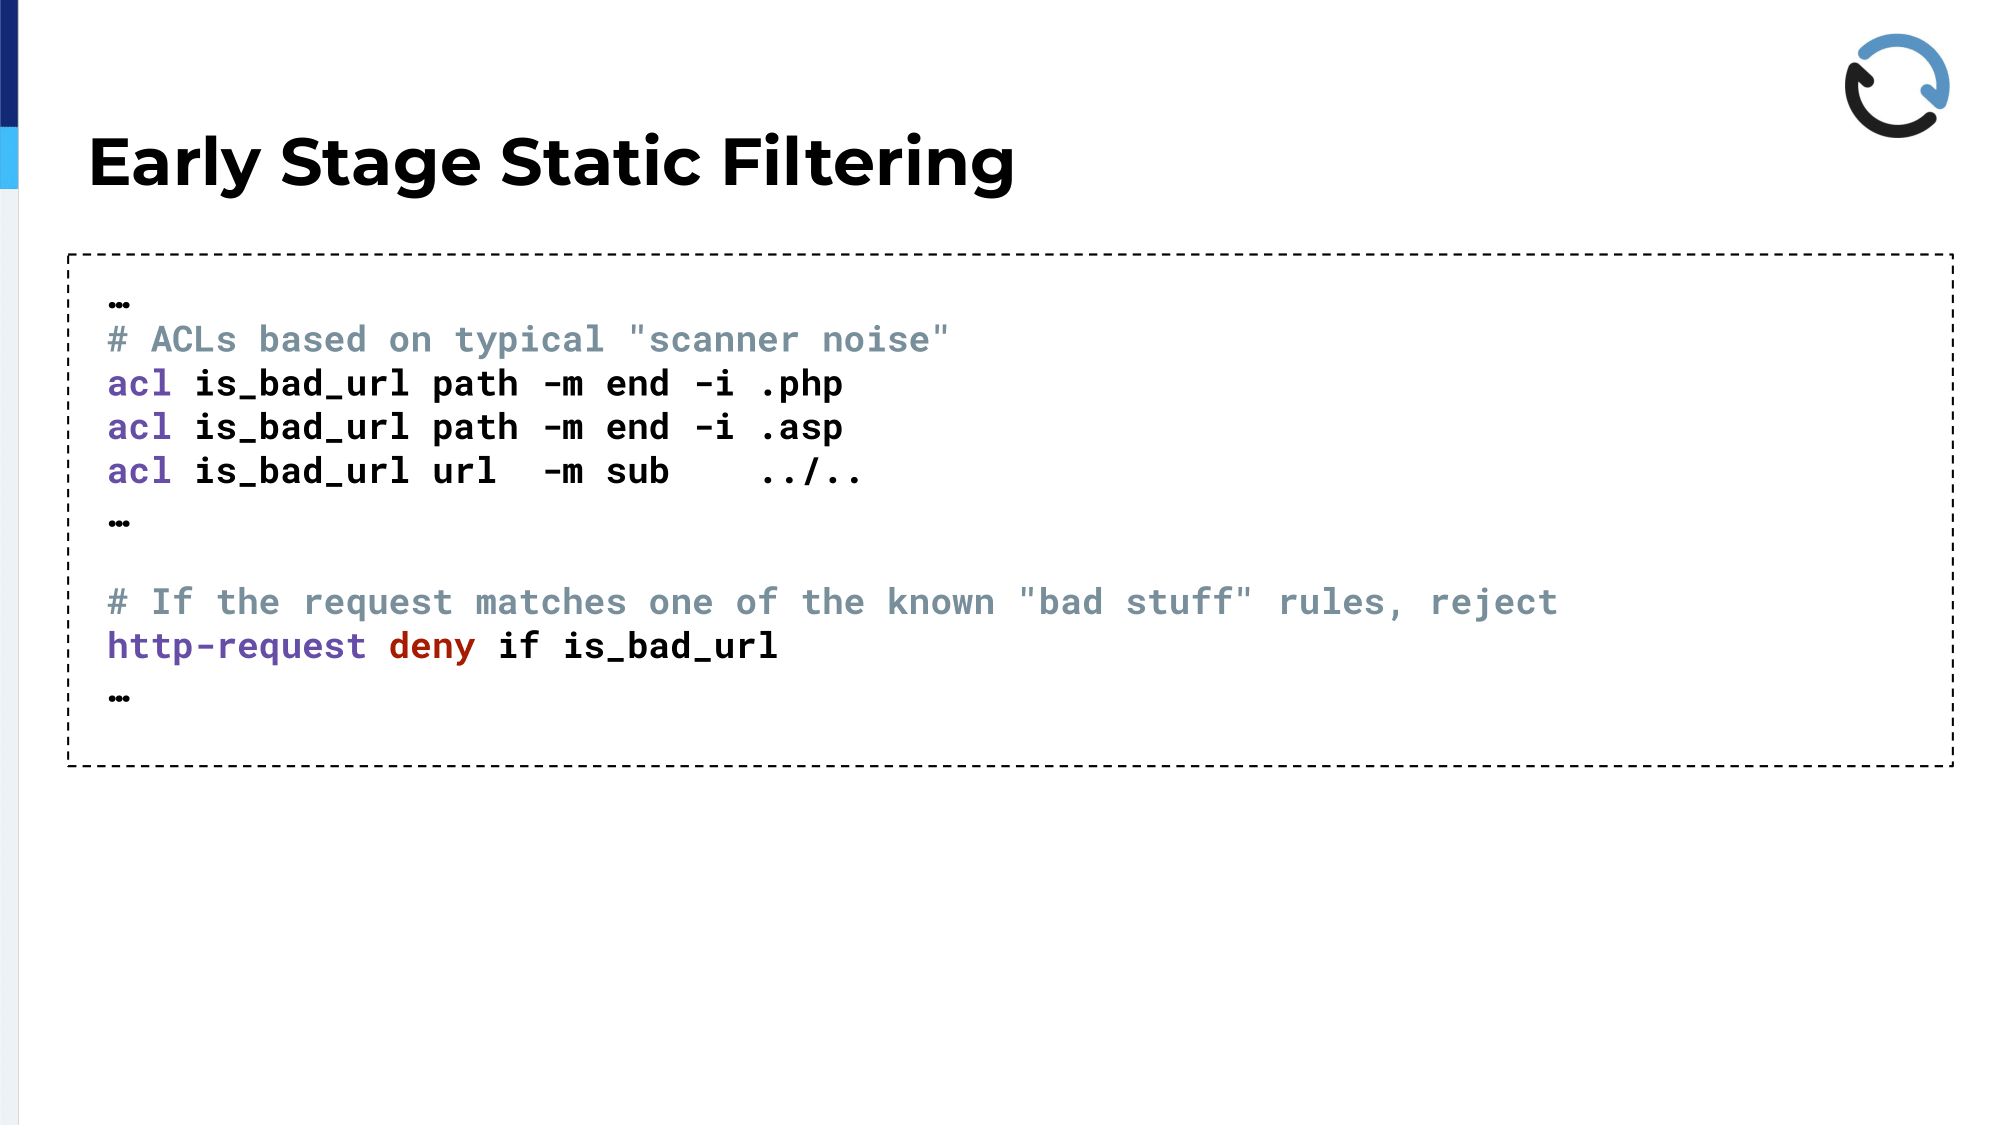
That’s an example of that early stage, static filtering in the HAProxy configuration file. That is just an excerpt so that it fits on the slide, but you see that ACL, isbadurl, the first one, just says, “Okay, if it ends in .php, it has to go.” The second one, ASP, ASPX, similar things. There are more matching cgi_bin and all kinds of other things that usually come in if you open ports 80 and 443; and the last one is a substring match for the path traversal stuff. Then the http-request deny then says, “Okay, if anything of the stuff above matches, then this thing gets a 403 and none of the backend has to ever see it.”
I like that way to specify the same ACL name multiple times very much because it makes for a nice and readable configuration file, because it’s just a logical or between all these conditions, and then you have one nice, short line that says, “If it is a match, your caller gets denied,” and the details are in separate lines above that. That’s pretty nice, I think.
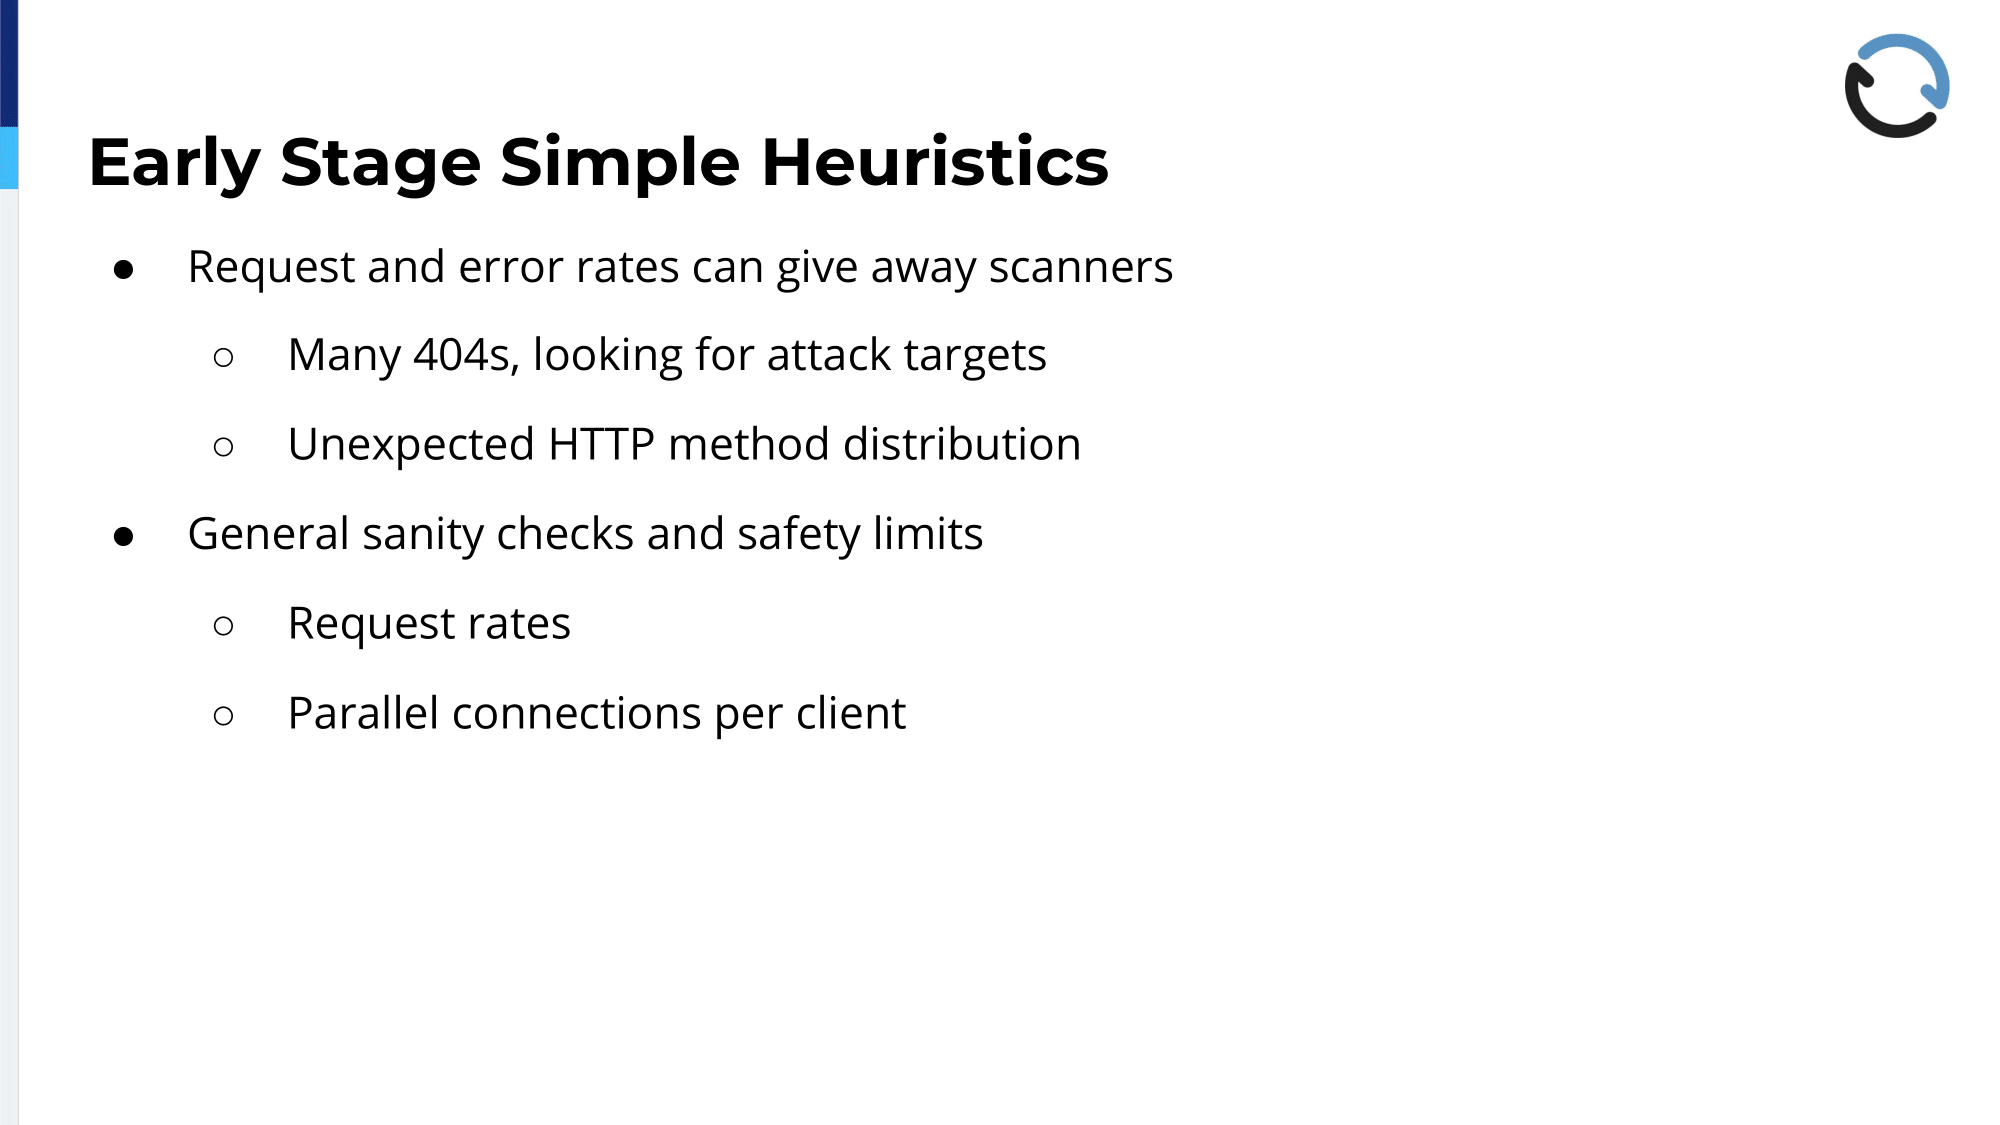
Once we’re done with that, in addition to these static rules, we employ some simple heuristics to get rid of more stuff, more unwanted traffic as early as we can. Those have a higher potential for false positives because, by nature, the static rules are quite easy to understand and you can make sure that there is not one thing in your backend that would get hit by that accidentally; With these statistics, it is so-so, so you’ll need to have a clear idea of what you’re dealing with normally to define the right thresholds in these ACLs, but with a combination of log analysis from previous traffic and knowledge about the application, it’s doable as well. That can be, for example, lots of 404s coming in over a short period of time, because that could be a broken client, but more usually it’s some kind of a vulnerability scanner that is just trying to detect what you’re running and going through a list of things like WordPress, login URLs, and SQL Server or phpMyAdmin and what not, just trying to figure out what it’s dealing with. If we see those, it’s a pretty strong indication that something is not right.
The same goes for method distribution. So, if you expect maybe 80% GETs and 20% POSTs and all of a sudden it’s vice versa from a certain client, that’s also a sign that this is probably not one of your regular customers. On top of that, we have some general sanitary checks and safety limits that we employ, that is just looking at the request rates and also how many parallel connections a client opens. Most of these regular API clients open one or two connections; Browser sometimes open, I think six is a number that’s in the back of my head, to get several resources at once, but anything that goes significantly above that is a sign of trouble.
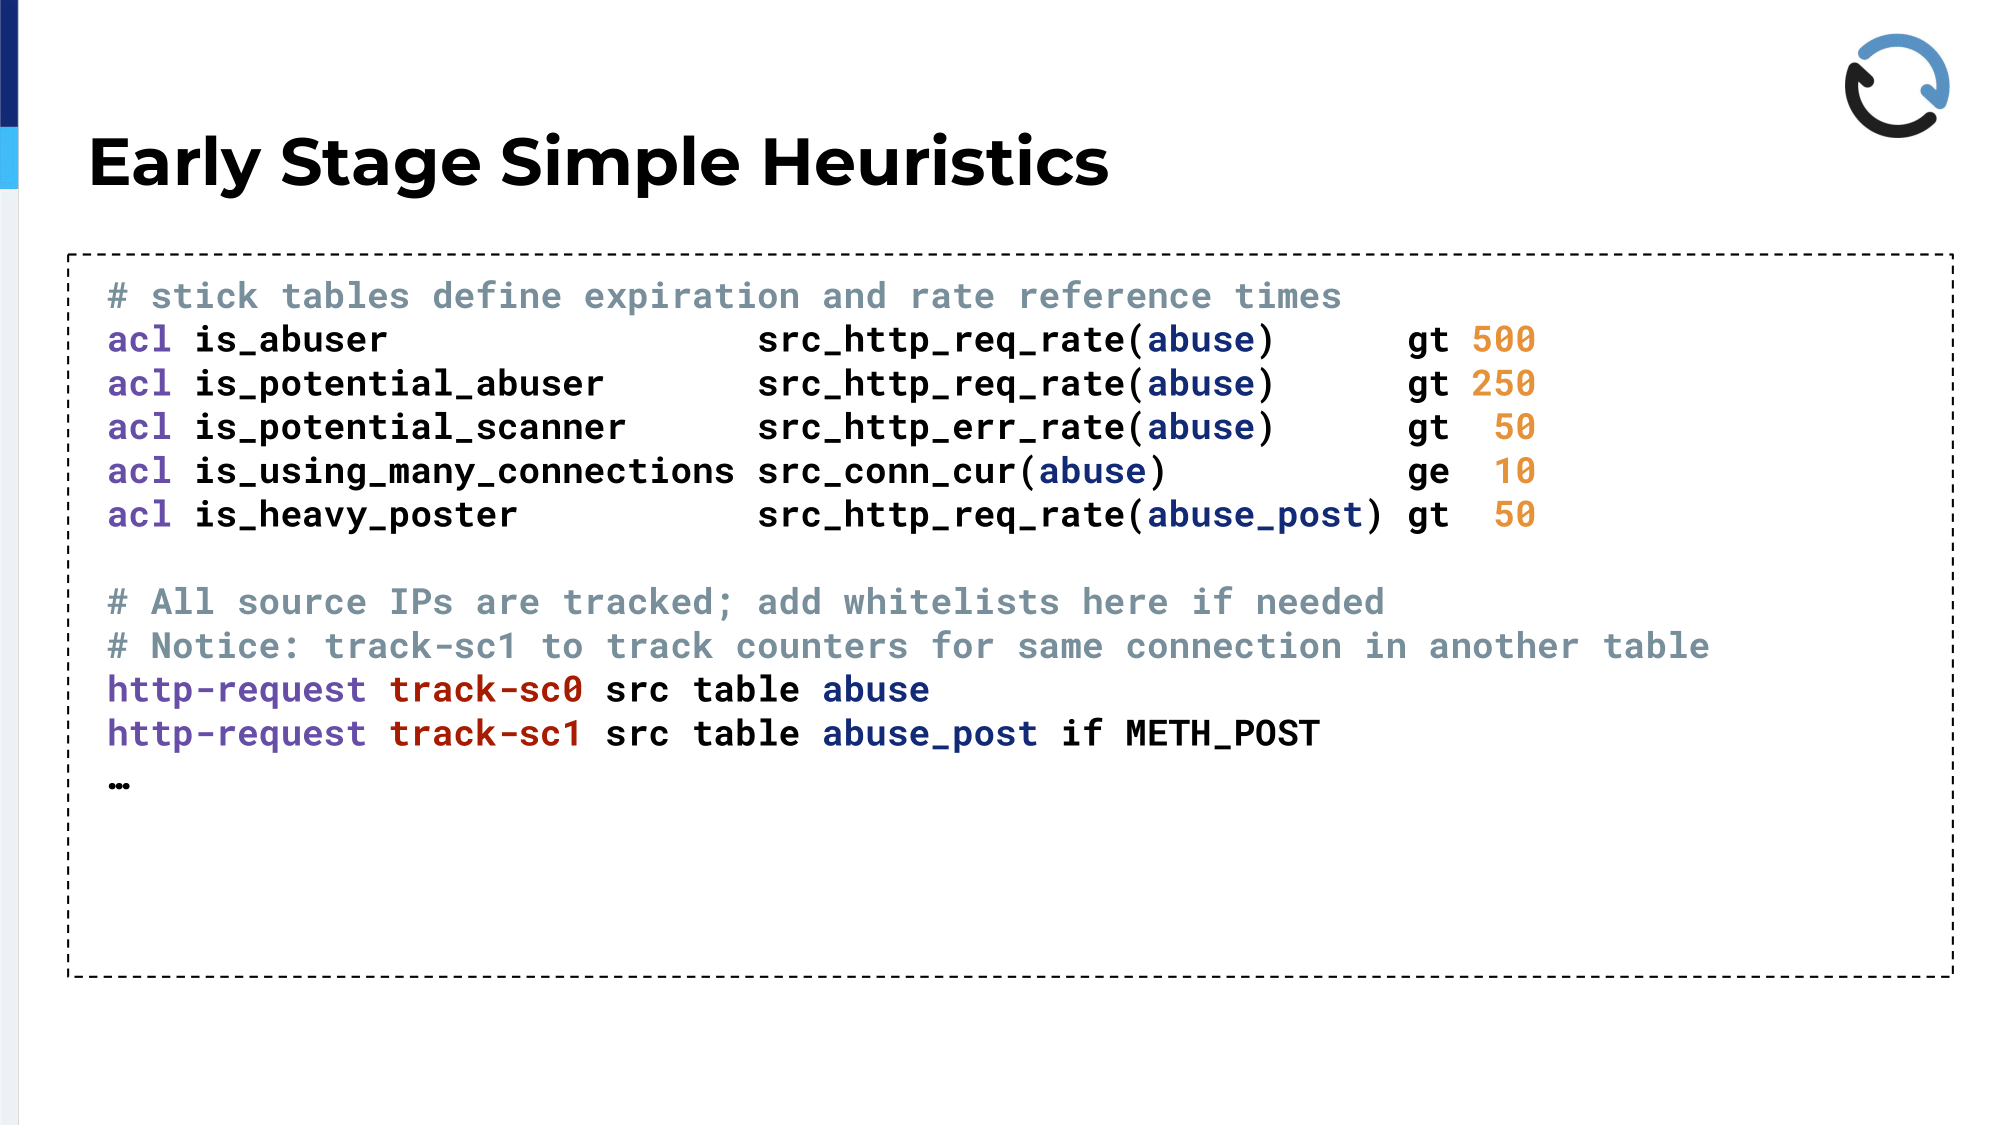
That’s an example of how that looks in the configuration again. The stick tables that are mentioned there, so abuse and abusepost, they are not on the slide, but they just define the time range that we calculate these statistics for. For example, the first line, isabuser, it’s just if, from a single source IP, we get more than 500 HTTP requests over that configured time period, we consider that as an abuse and that will have consequences later on. Something might be a potential abuser. For the sake of example, that’s half that value, so you might handle that differently. That’s what I was talking about earlier, the tradeoff, we have to know what regular traffic looks like and you have to be careful when you set these rules.
The thing about the vulnerability scanners: ispotentialscanner, where the error rate is higher than you would expect, isusingmany_connections, that just looks at the actual connections without going into the traffic, and something we declare as a heavy poster is if they exceed more POSTs over a certain period of time. We’ve found out that we had to use a different time period for POST requests because lots of vulnerability scanners seem to stretch those out over longer periods of time, I suspect to fly under the radar and not get detected so easily; So, we had to tweak the values there.
Then, we track all connections coming in in stick tables with these stick counters. In the abuse table, they all go in there and then if it’s a POST it also goes into that second table. If someone then comes in…well, we need to read that from the bottom a bit because that’s like looking at the time it works from the bottom. So, if something matches one of the ACLs, for example if someone is a heavy poster, what that ACL on the page before matches, we respond with a 429, which is the status code for just telling them to slow down, too many requests. If it’s a regular client, maybe a person watching this, they have a chance of understanding what’s going on and throttling their requests.
If someone, however, gets marked, if they really are matched as an abuser—so you see the first one, they are getting marked as banned—so that means we raise a flag for that IP in the stick table—and these are the top two ACLs on that page. If someone has already been banned because we have raised the flag earlier and they are using very many connections, we just silently drop that request. That is intended to save resources on the load balancer and not to keep all these connections open and be so kind, and also ship them back a nice error response. We just silently drop those. If they are not using many connections, we at least delay them for a short while with the tarpit feature and then they get a 500 back. So, we try to play nice and respond with 429s as long as we can. In case we are accidentally matching someone, they have a chance to at least contact us and tell us what’s going on.
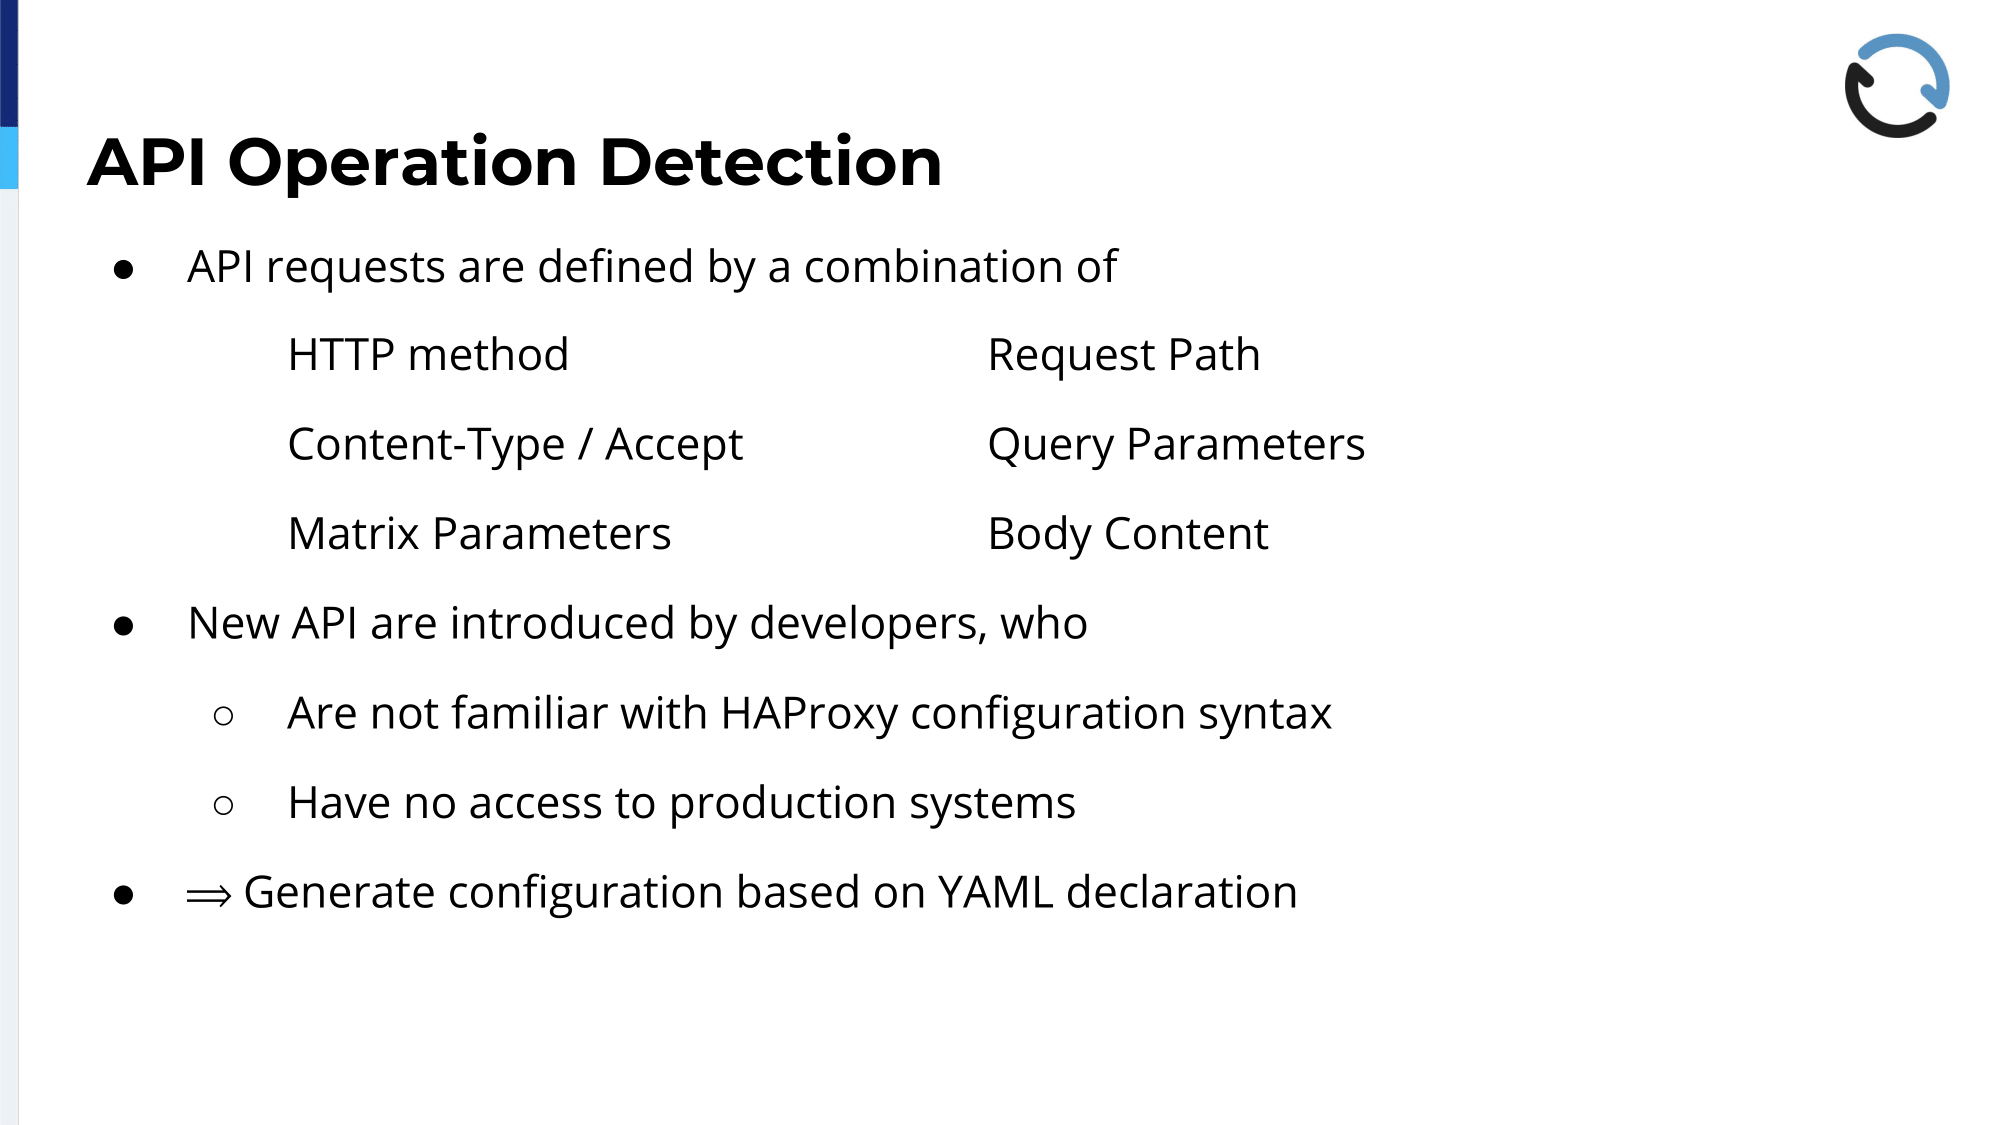
Now with all of that basic spam traffic gone, we can focus on gathering some useful data about what remains, which is hopefully just the application traffic that we’re interested in; and to do that we wanted to have an easy way to see in the logs, for example, what kind of a request, like which API operation, is coming in. An API operation is defined by a combination of any of these things there on the slide, so a particular HTTP method paired with a certain request path, having a Content-Type header set to such and such value, and with any of these combinations we define: This is an API operation of this kind. Last time I checked, we had around 100 of those. It’s probably more, it could be more by now, and because some of the endpoints, some of the addresses are overloaded, we also sometimes need to inspect the body content of what is being posted to that endpoint to understand which action the user actually requested.
New APIs on the REST API are introduced by our developers and they usually are not familiar with the HAProxy configuration syntax, nor should they have to be, and also they have no access to the production system. We wanted to give them an easy way to add to the configuration without having to go too low level, so we invented, came up with, a YAML-based declaration of these API operations that whenever something new gets added, they can add that to the YAML file without having to think too much about it.
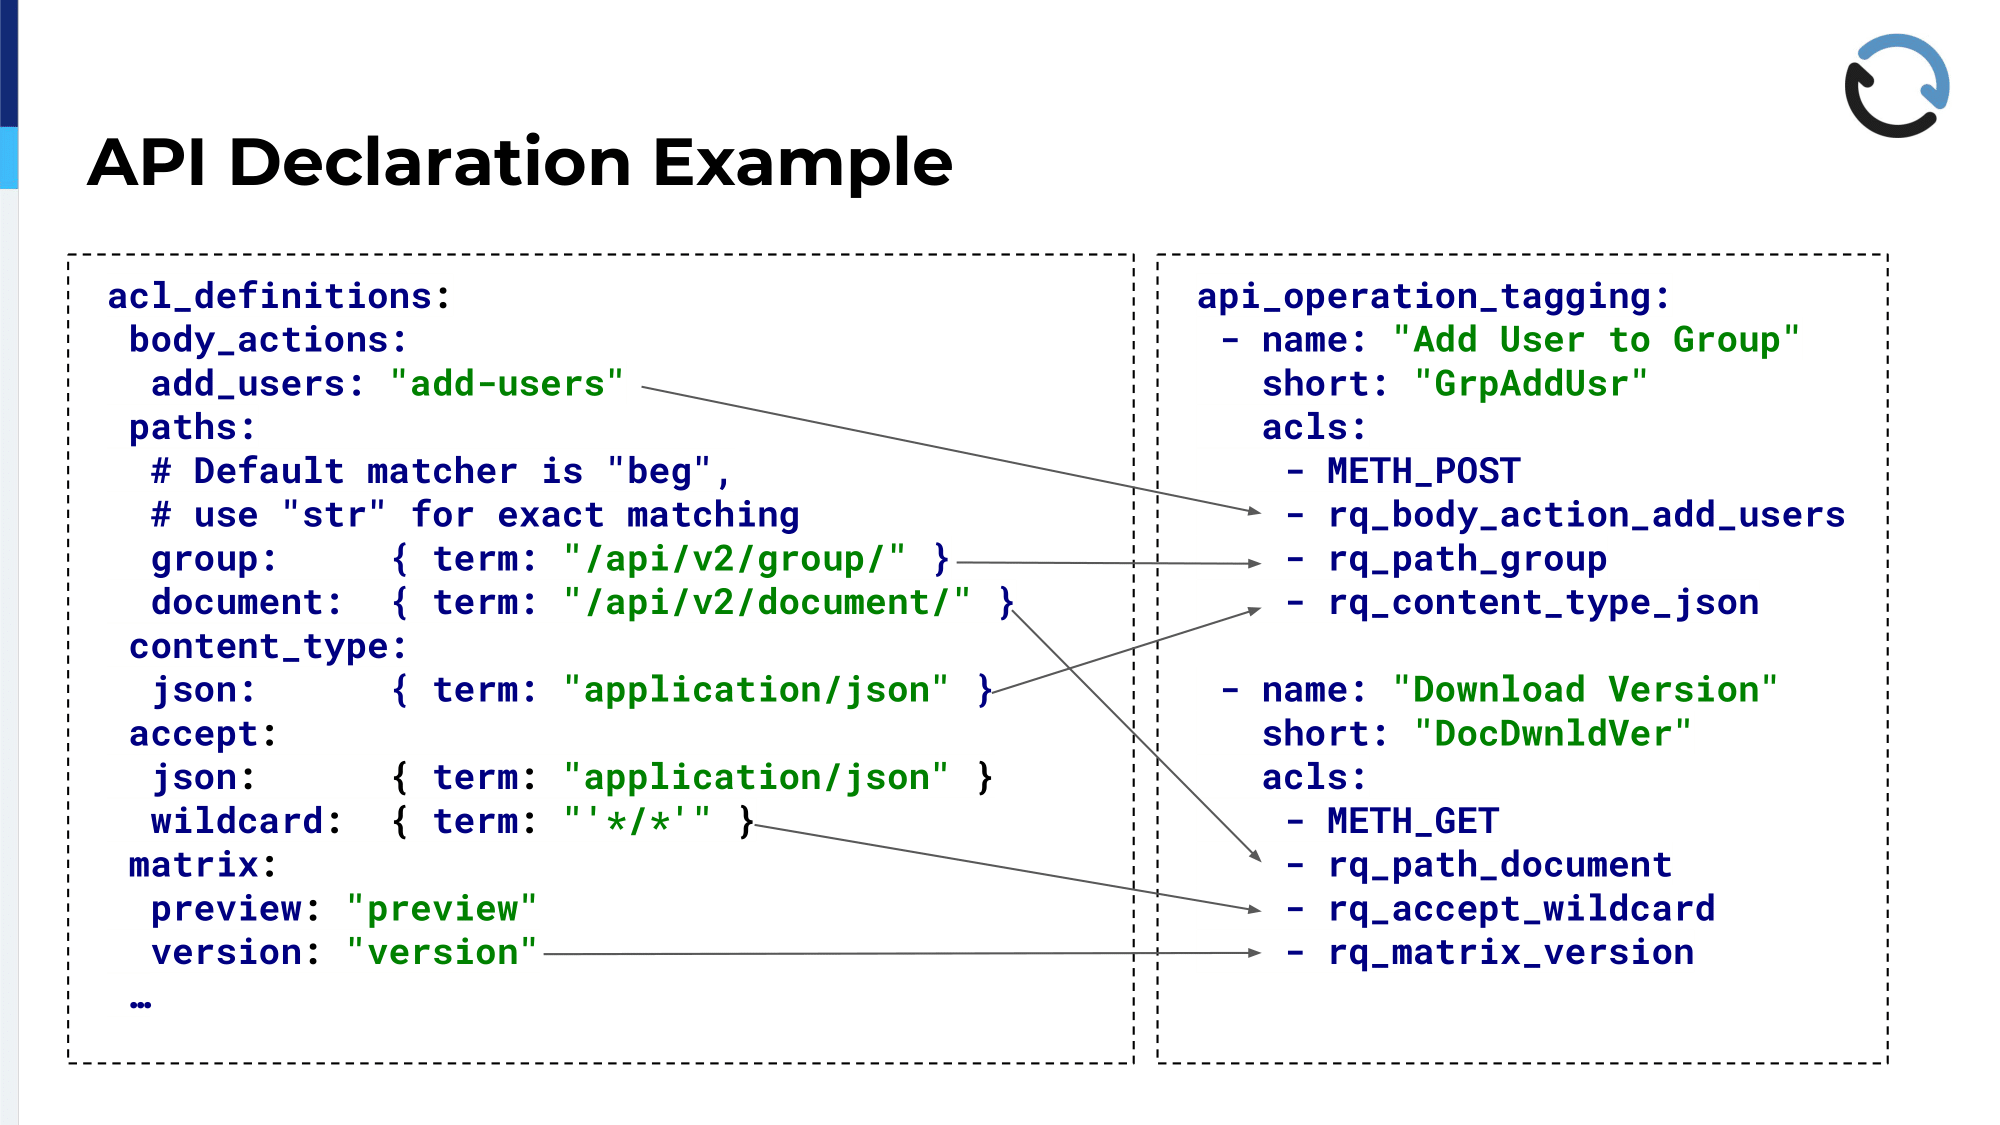
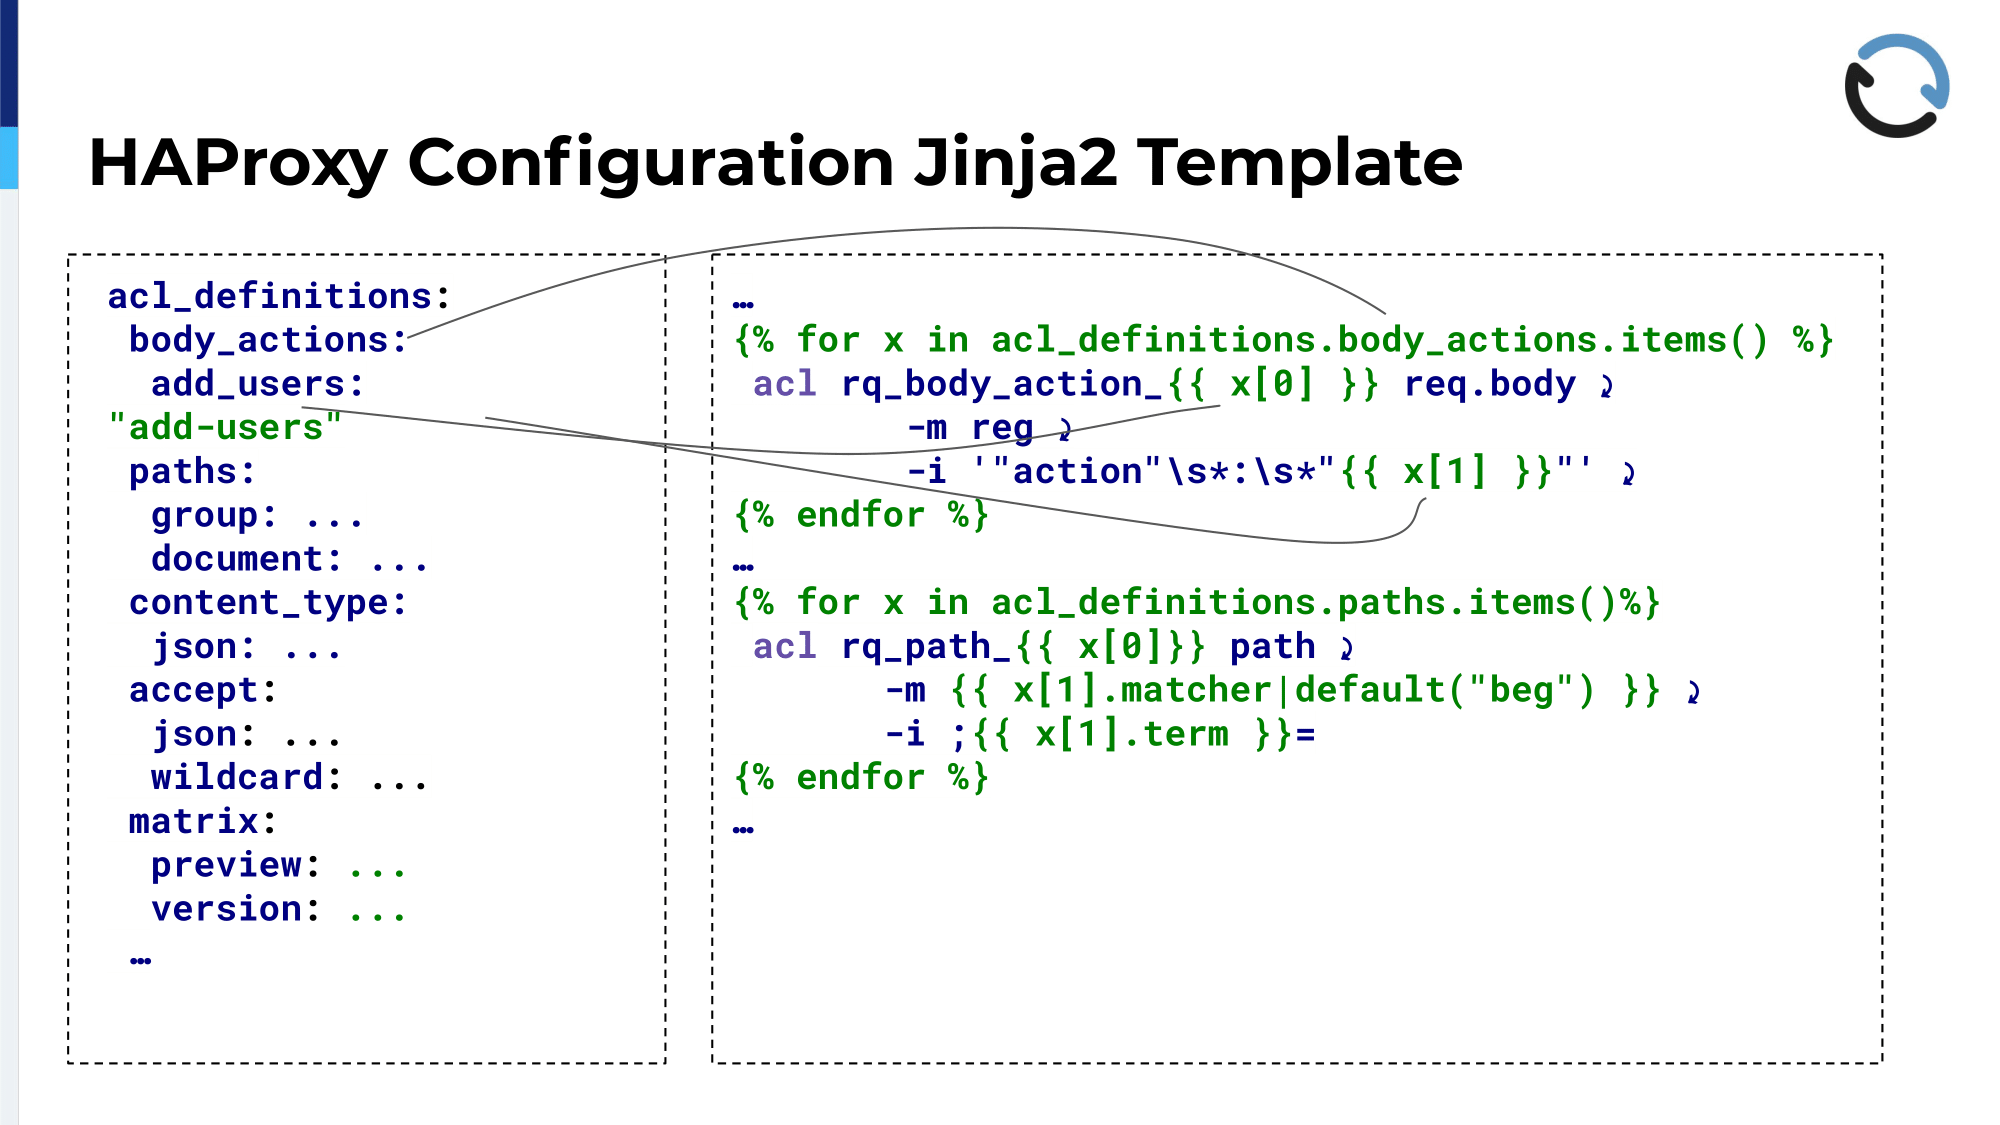
That’s an example. It’s kind of a two-level approach; On the left-hand side, in that left-hand box, you see the YAML declaration of just, like, basic ACL building blocks. We do this to avoid repetition and prevent typos so that if someone has edits, in this case, for example, one of the paths, /api/v2/document/, only needs to be placed in there once and then can be referenced using the variable. Same goes for the Content-Type headers or the Accept headers and the matrix parameters and whatever I said earlier, goes into defining what an API operation is.
On the right-hand side, that is the part—so the left-hand part is basically done by us, by the Ops team more or less, and it seldom changes—the right-hand side on the other hand, that is where, more or less, everyone can contribute. You probably already see kind of an obvious naming scheme there, a naming convention, and someone might decide: Okay, there is an API operation that adds a user to a group, whatever that means in the context of the system, but that action is defined by being posted, being directed at the path for the group resource, having a Content-Type of JSON, and also having a body action add-users. That’s on the left-hand side there. You can mix and match these things from the left-hand side and put them into a list of ACLs that make up this API operation and what you see there is a “short”, that’s the actual tag, like a short description of that operation; That’s what you will find in in the log later on.
Second example, very similar, just in this case it’s a GET request and it goes to a different path and it has a different combination of things. So, in the final file there will be lots and lots of these for all the operations, but you can declare that without having any knowledge of what HAProxy ACLs look like and how they work.
Actually, for HAProxy to use these, we still need to get them into the configuration file at some point and we do this with Ansible. As I said, this is what we use for deploying a configuration to the running servers and you can see there that it’s basically just taking the stuff from the left-hand side, these ACL definitions; First, iterate over them, and then create lots and lots of ACL lines that then follow the same naming conventions. That’s where this comes from and depending on what type, if it’s a body action, if it’s a path, if it’s a header definition for a content type and so forth, the static parts come from the template and then are just repeated over and over to fill in the gaps with the particular API operations.
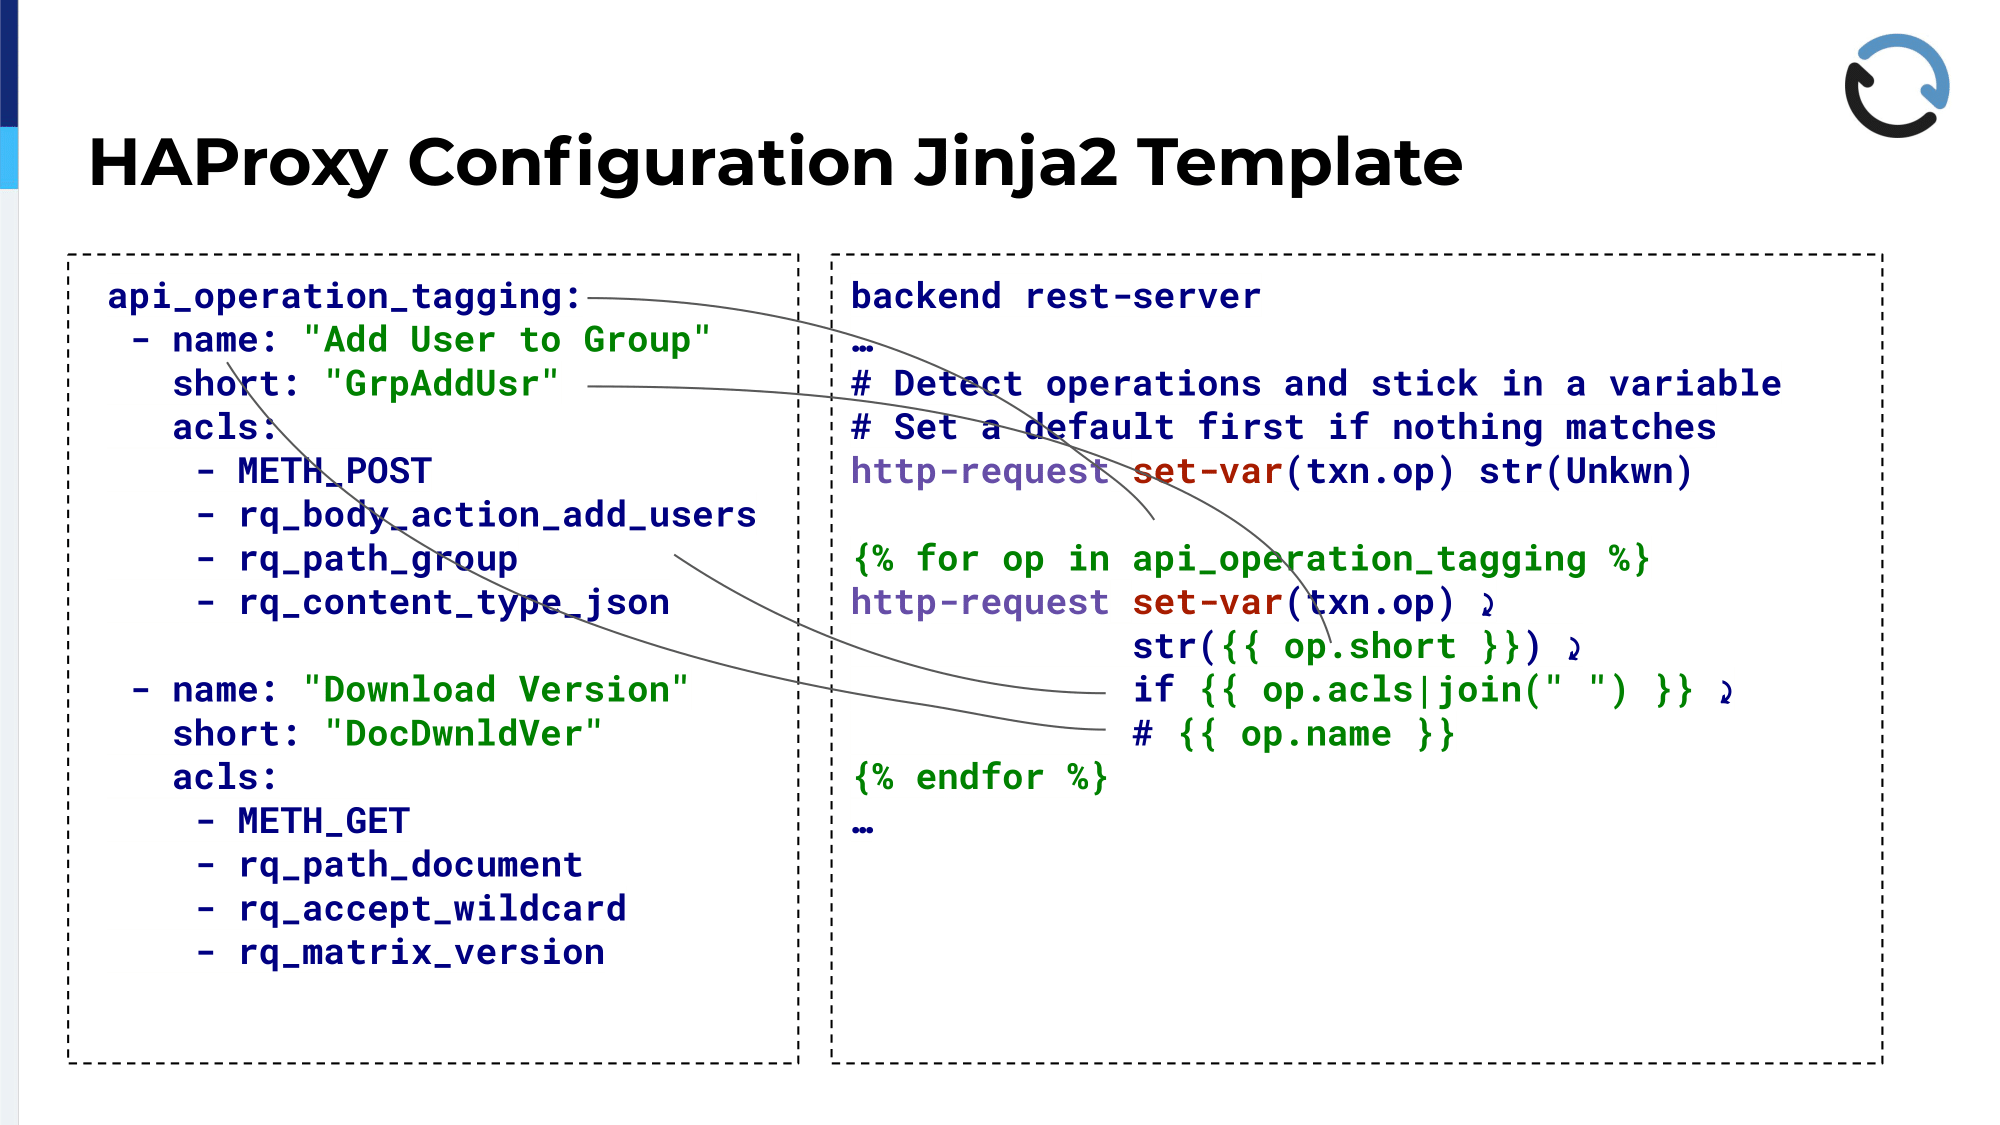
Then comes the second part in the configuration file again, similar approach. We iterate over all these API operation tagging elements and fill in the blanks in http-requests set-var instructions in the HAProxy config. We’ll see a complete rendered example of that in the next slide, but you can see here too that all these parts are just filled into the appropriate places in the configuration files. We basically never have to touch an HAProxy file by hand anymore. That used to be different, we used to add these by hand whenever something was changed, but it always needed communication between developers and there was a time gap between the deployment of this and the changing of the rules, so this is much nicer and less error prone.
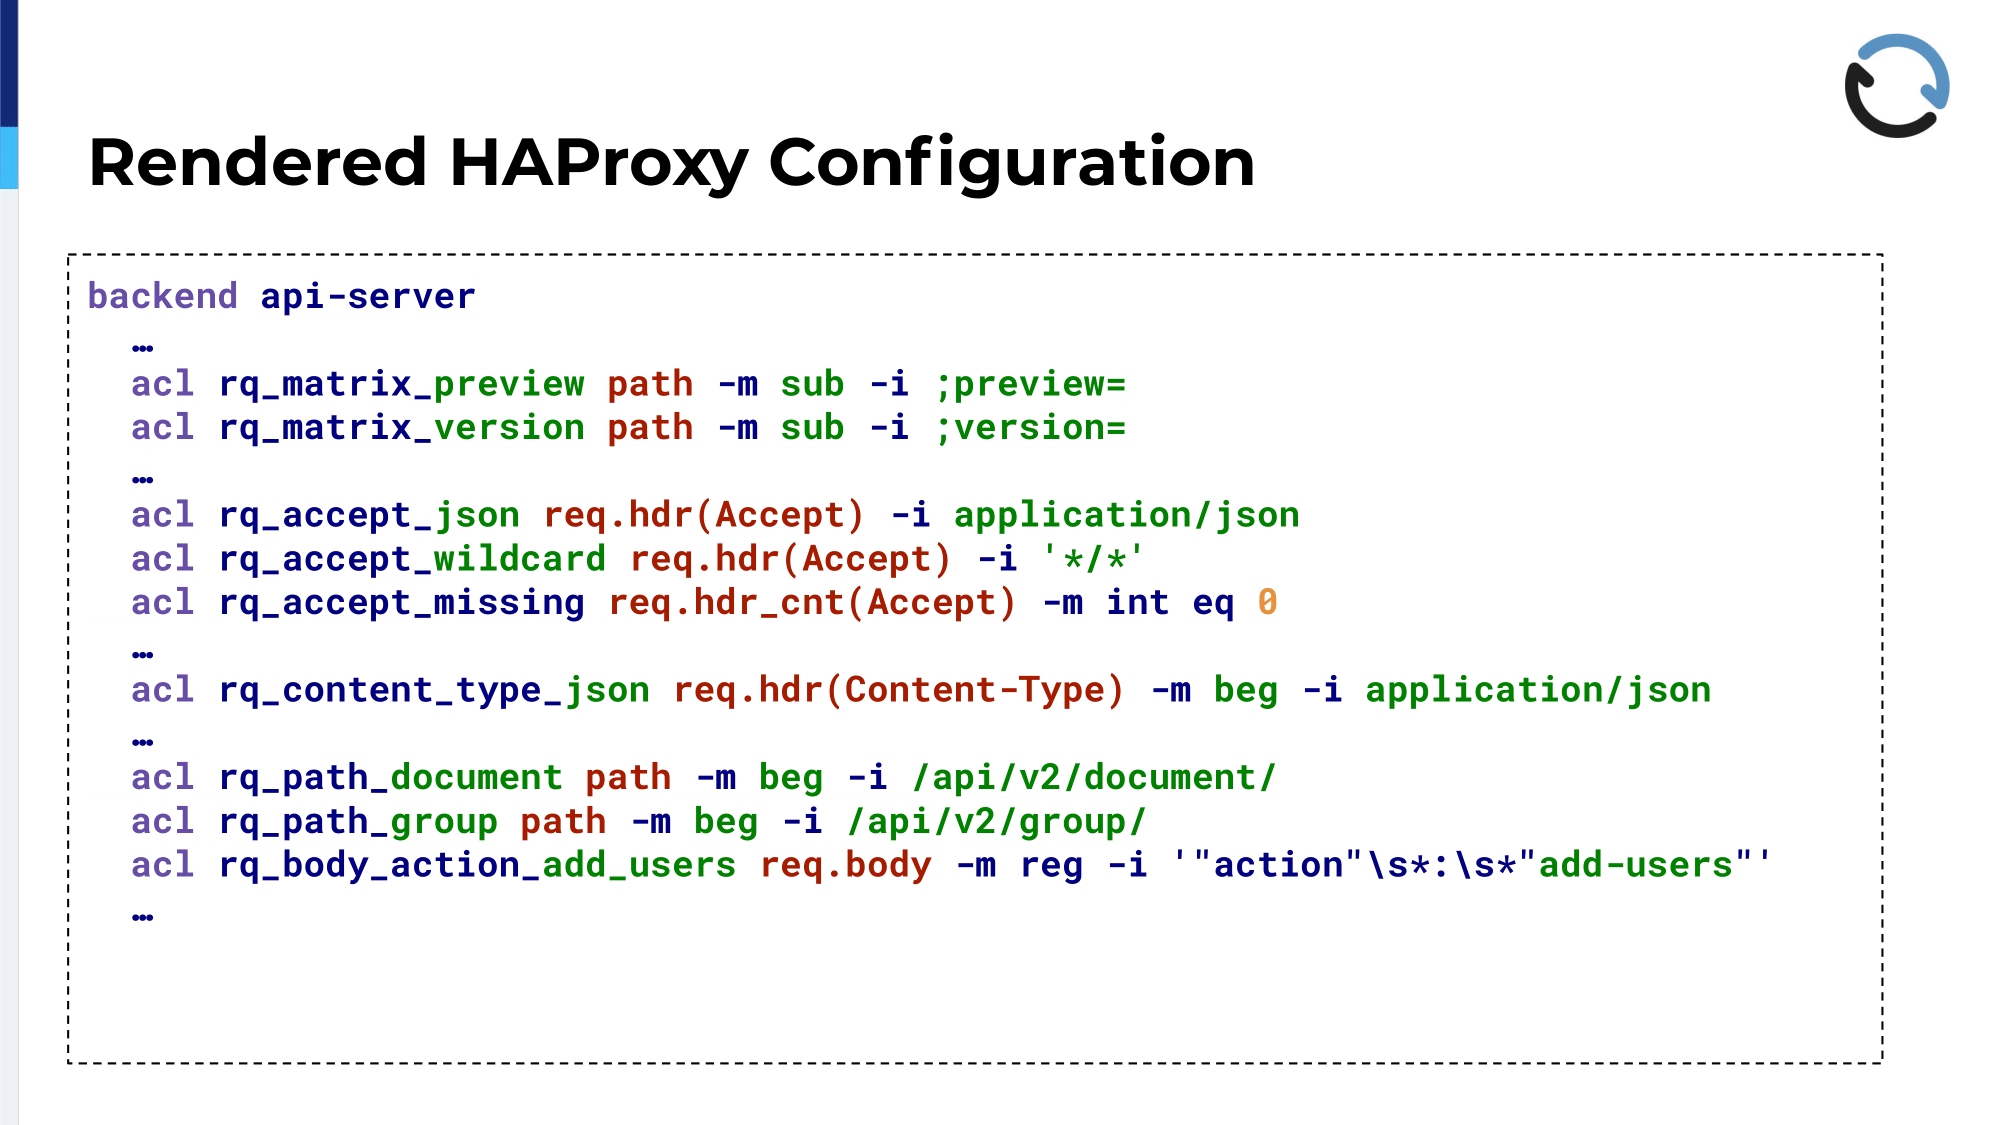
This is the ACL part rendered via that template. It’s shortened, as you can see, with ellipsis in the middle. For example, the top one is matching a request parameter for previews, just a substring match. Then that middle block you see, it matches some headers, in this case the Accept header. The missing, the ACL rqacceptmissing, that is added statically in the template because it turns out in some cases we just want to know if that header is missing and not if it has a specific value, so that is just added there without coming from the YAML file; Same goes for Content-Type and so forth.
The last one on the slide, that is where we inspect the body of the request. That’s what I said earlier; Sometimes we need to check out what we are being sent in the body, where we cannot determine what operation it is just by looking at all the regular things. We do that by capturing the first, I think, 250, 256 bytes or so of the actual request and then do a regular expression match on that. It’s not the nicest thing to figure out if a JSON document contains a certain value, but it works well enough. That’s also something that we heard earlier. So, I am not complaining. It’s quick, it works, so it’s good enough for me.
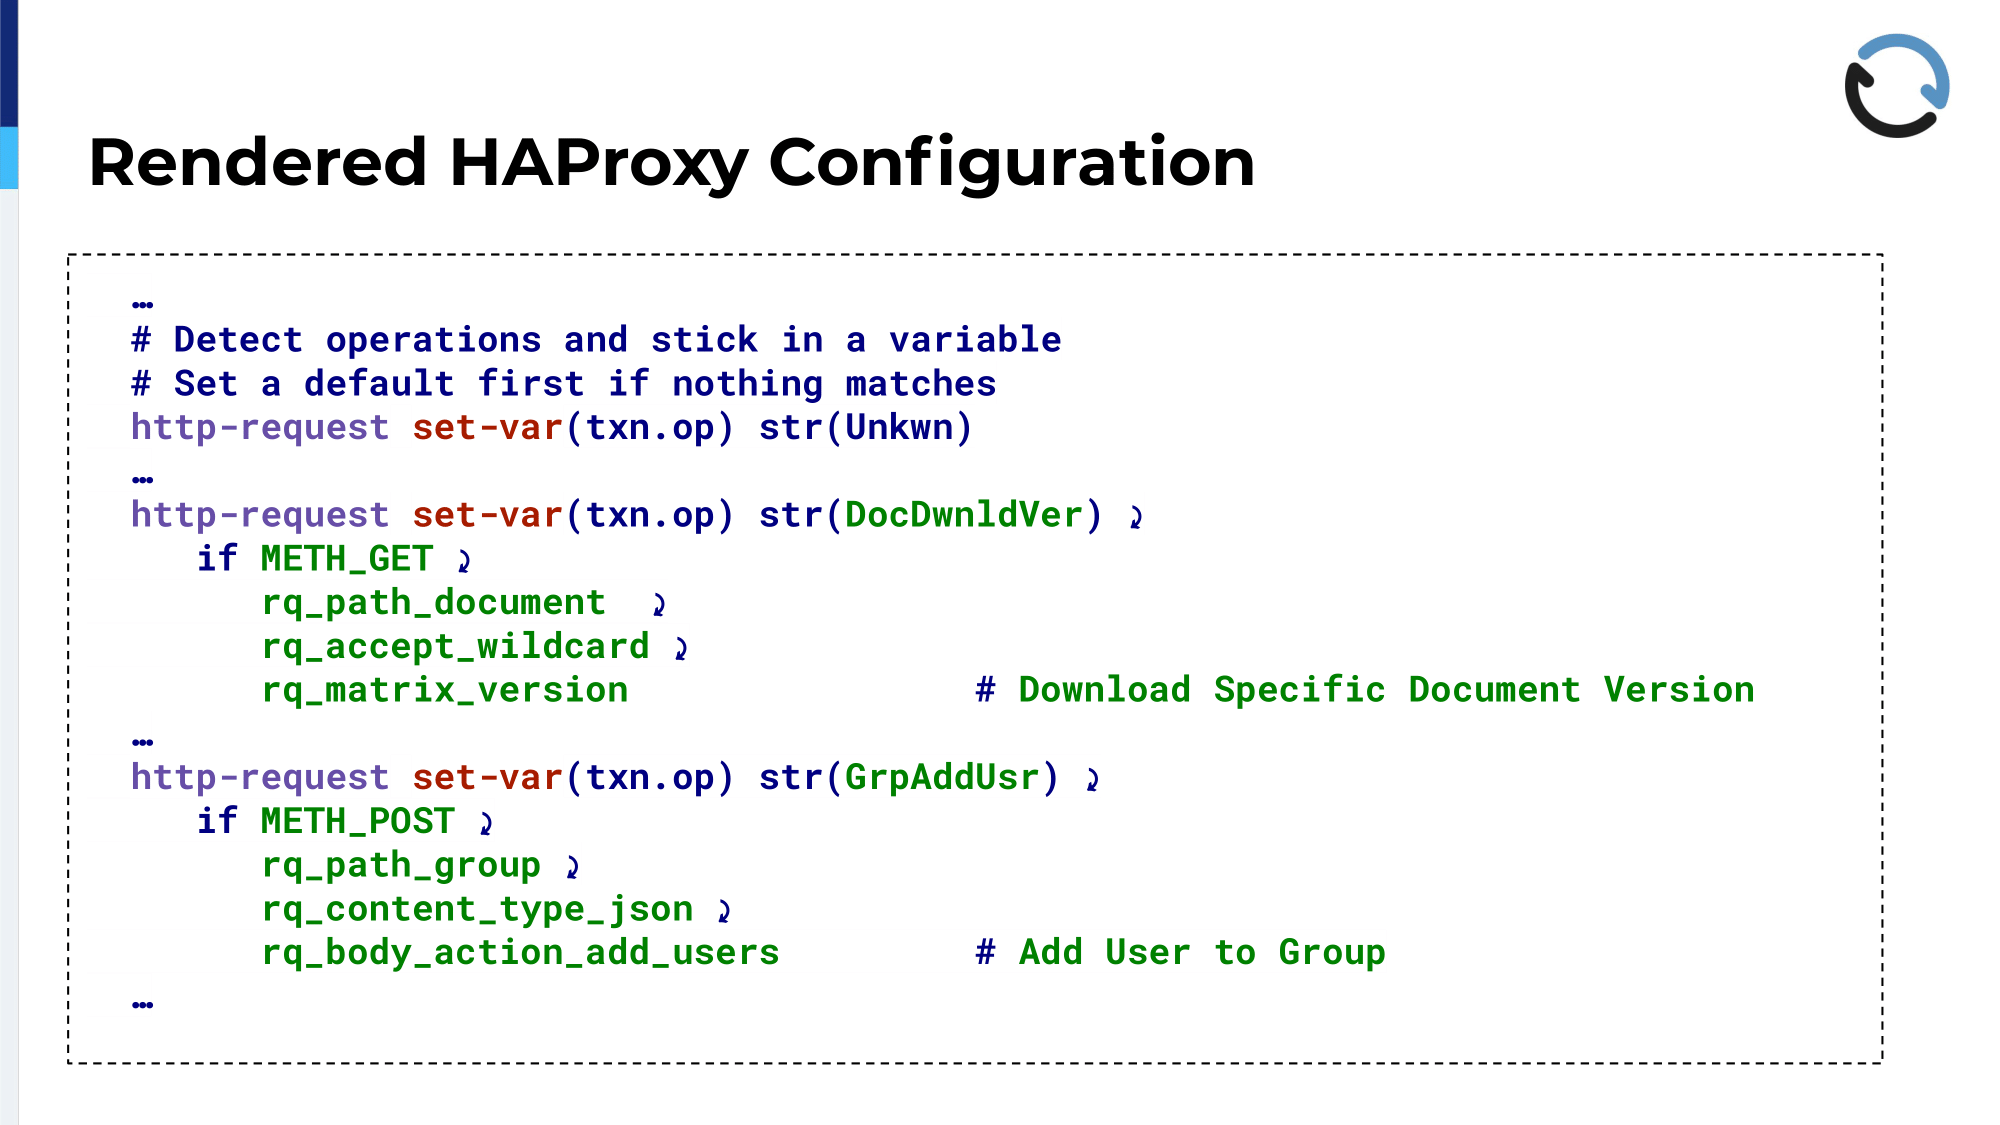
This is the second part; One of these is rendered for each of the different operations that are defined. As a default, when the request comes in it goes through the rules from top to bottom, and you see the first one sets this txn.op variable, that is the API operation, where you actually store it, sets it to the string “Unkwn” so that in case someone forgot to add a new operation that we have to that YAML file, it will just fall through all of those and remain at that static string “Unkwn”, so that at least, afterwards we can look at the output and determine, okay, someone forgot to add something, and what was it, and add that rule later. Otherwise, it sets the string to whatever the shorthand was in the YAML file into that variable and all these individual ACL fragments are compiled into that. For good measure, if you have to look at the final rendered file, you see what was the name, it’s rendered as a comment at the end of each of these lines. Maybe a feature request: It would be nice to have multi-line configuration.
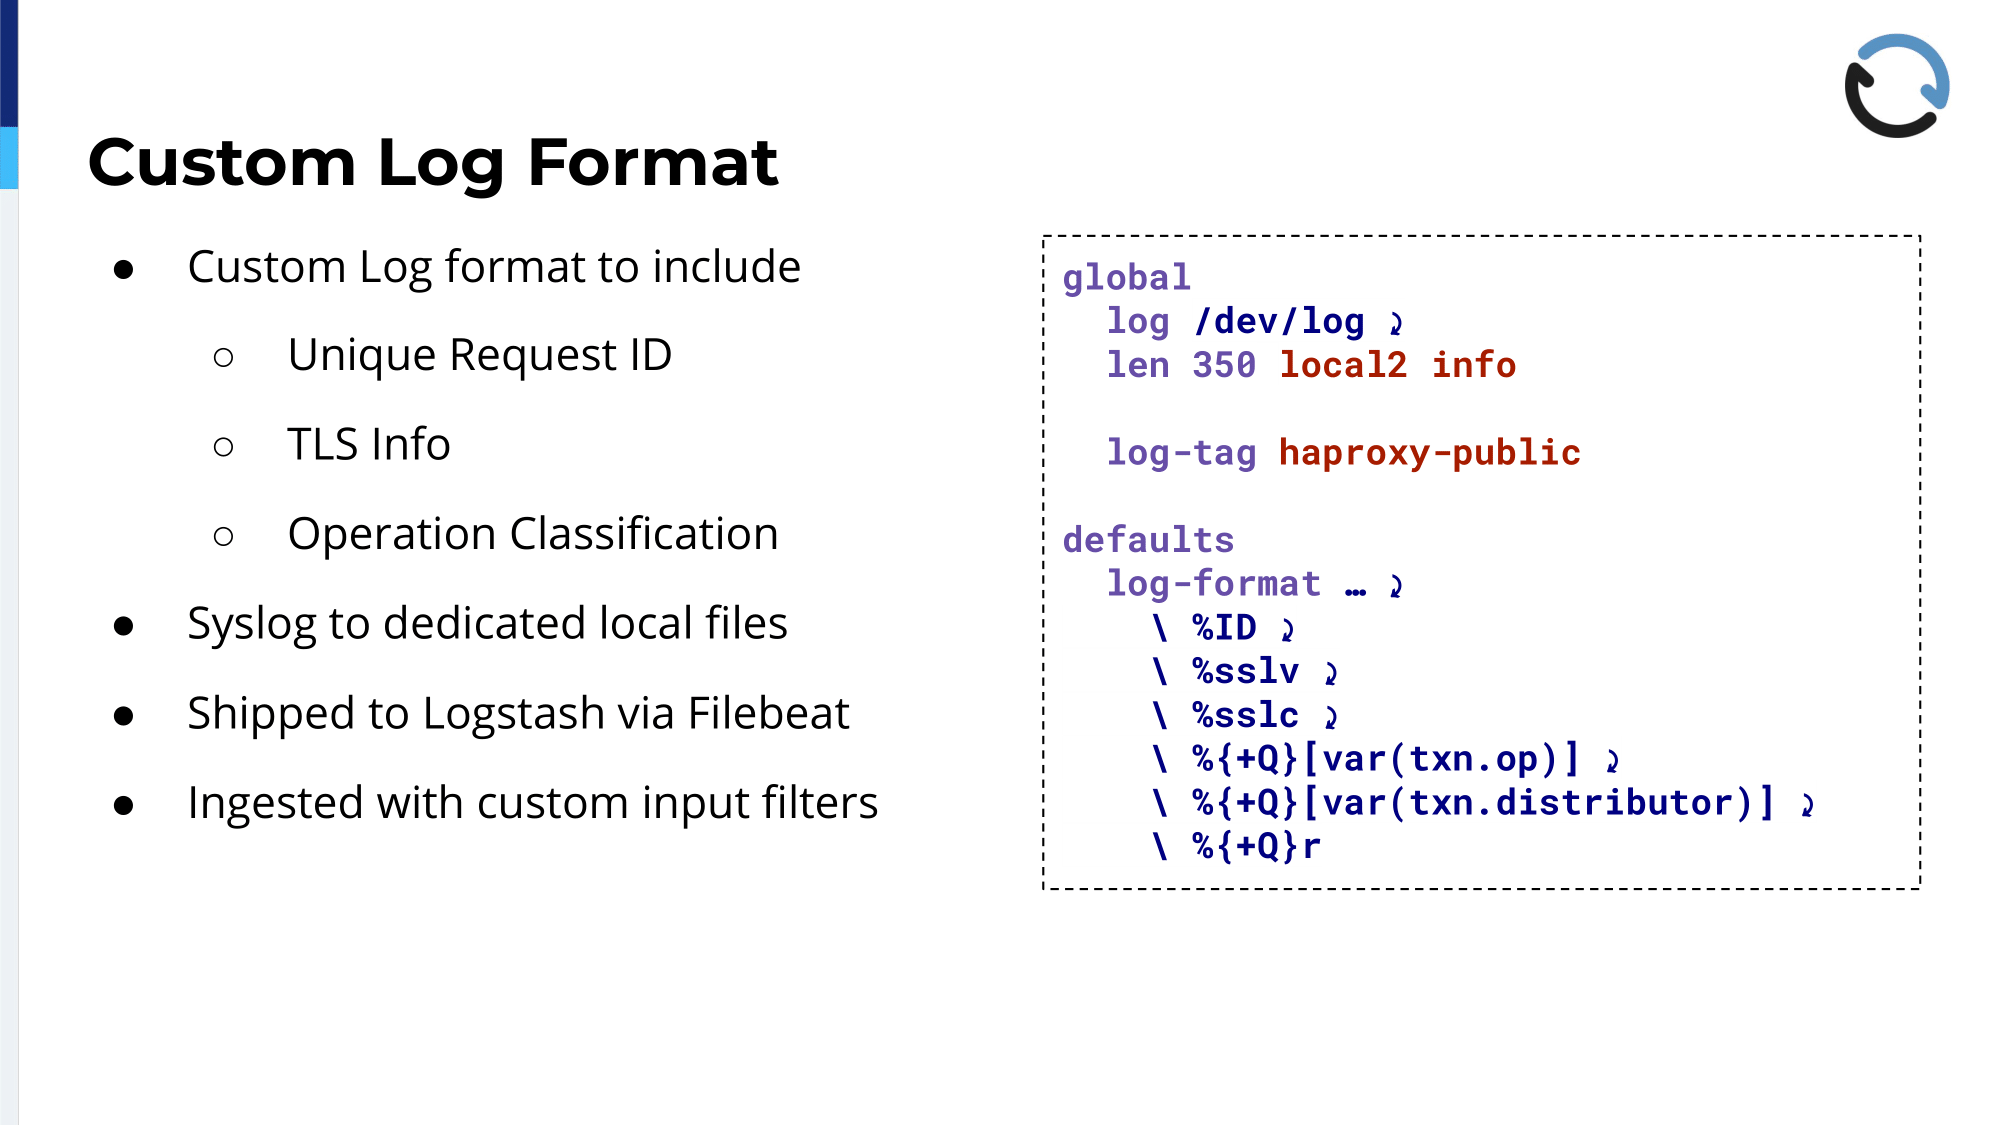
Now, all these operations have been tagged, the data is in HAProxy now. What do we do with it? Because right now it’s just in memory of the load balancer and it’s not helpful if it stays there. So, what we do at the moment, we’re playing around with a few different ideas right now because this has its limits, but we have a custom log format defined for these backends. That includes, first of all, a unique request ID. That’s also a default HAProxy feature that encodes the client IP, the client port, and the same for destination IP and port, and I think some kind of a counter or timestamp.
That makes it easier for when you want to correlate an incoming request with application logs, for example. If a problem occurs in the application, the exception handler usually takes that value, which was sent over as a header, and also includes that in its logging output. So you have a chance to match up errors and the request that caused them.
It gets logged to Syslog, to local2 in this case, at info level, but that doesn’t matter. What matters is that we have an Rsyslog configuration that looks at exactly this with a tag haproxy-public and sends that into a dedicated file. Right now we are limiting the line length to 350, that’s just a precaution, and we are rotating these hourly because it’s quite a lot of stuff that accumulates there, but what happens then is once it reaches that local file, we have Filebeat running on all these instances and it picks up these logs, follows them as they get written, and ships the whole stuff off to the ELK stack. We have an ELK cluster sitting somewhere else and that is prepared to receive the data formatted in this way.
It also includes the TLS version and the cipher that was actually negotiated. A few weeks ago, or a month by now, we enforced TLS version 1.2 as a minimum; There were very few clients left that used older versions and those were, yeah, we could just ignore them because it was mostly none of the clients that we want to support, that old stuff.
Then finally, of course, the variable; You can see that in the third line from the bottom, the txn.op variable. That is one of these logged elements. The distributor thing is another one that we add that gets added in the configuration at a different point that just helps us to assign requests and know which of these third party resellers it was coming from. Then it gets ingested in Logstash with a custom input filter and that then puts all the values that are in the log line; So this is not complete. It also includes, of course, timing information and all the other stuff that is normally contained in the default Apache, HAProxy log format. That is then ingested and put into Elasticsearch fields so that you can filter on it and search for it and make nice graphs.
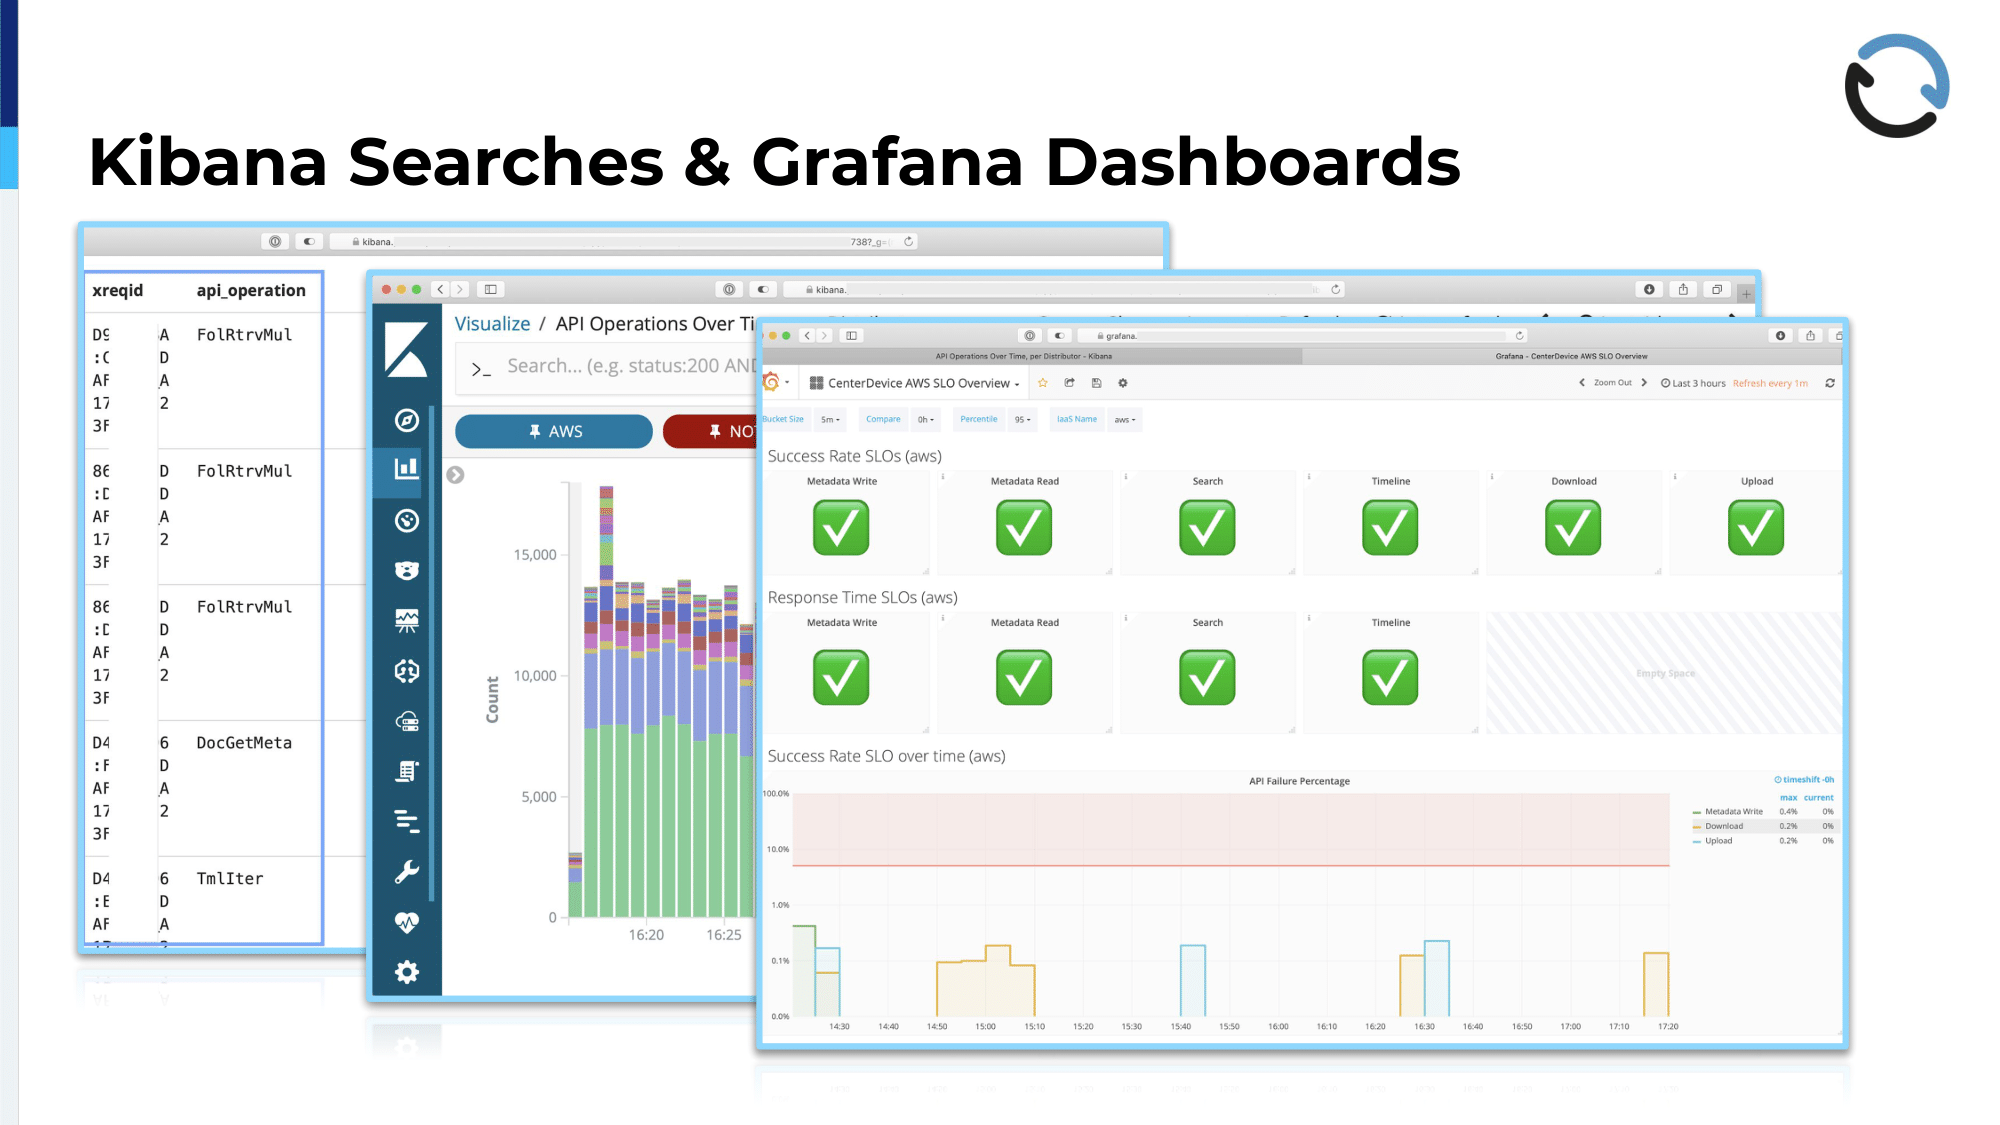
These are a few examples of what that looks like, what we do with it. This first one, it was kind of hard to get that tabular view into a screenshot that would look nice, so I gave it my best! The left-hand column, you see that it’s labeled xreqid. If you can read that, that is the left-most one, that is this generated ID. I had to put a white bar on top of it because in theory you could have calculated IPs from that. Then the API operation, that’s actually the meat of the matter where we then can give everyone access to that thing and they can filter by API operation depending on what they’re looking at and get all the timing, termination state, and so forth, so everything that you would normally have to look up in a file.
The second one is one example of a visualization for the API operations over time and for distributors. So, if you would scroll down and there would be one of these graphs for each of the distributors that we have, and it’s quite interesting to see—which we weren’t so aware before we had this—that different distributors, different resellers have very different ways of how they use our system. You can clearly see that in the distribution of which operations are more popular with a specific client, specific distributors. This then gives you an indication of where it might make sense to look at performance improvements or, in some cases, it turned out that we just approached them and asked if they were aware that they were doing thousands upon thousands of calls of a specific kind and what the intent behind that was, and it turned either out that it was a bug in their code and that they weren’t even…they didn’t know that they were doing this, or in some cases where they said, “Yeah, we tried to achieve such and such thing,” and we could then help them and say, “That would be way more efficient if you did it in a different way without using, like polling, for example.
That third screenshot, that’s an example of a Grafana dashboard that is fed from that same data, that is showing the success rate and response times of some key operations. So, we have service level objectives that we try to meet for basically all of the operations that we have, but as you can imagine, being a document-related system, if you feed stuff in, if search is quick that would be nice because that is the main thing, the main interface that you have to get back at your data. So, we monitor this, but also the same thing for all kinds of key operations and key features that we have. That graph just shows if over the last…I’m not sure how long that graph is configured now…but of the last period of time, the 95th percentile met those requirements; and the bottom, which is a bit cut off, is the response time of these key operations, where we also say at most they should be 500 milliseconds, say, or 100 milliseconds depending on what operation we’re looking at.
As you can imagine, these different ways to view the same data, they are helpful for different purposes and different people, for troubleshooting, for fault finding. That tabular view is perfect because you can dig down into all details; You can just open it up and everyone has their favorite, saved searches for the typical stuff that they work on; They can look into that without having to figure out which grep rules now to use when going through text files. On the other hand, just from compliance standpoints and reporting, these more graphical things are very helpful too.
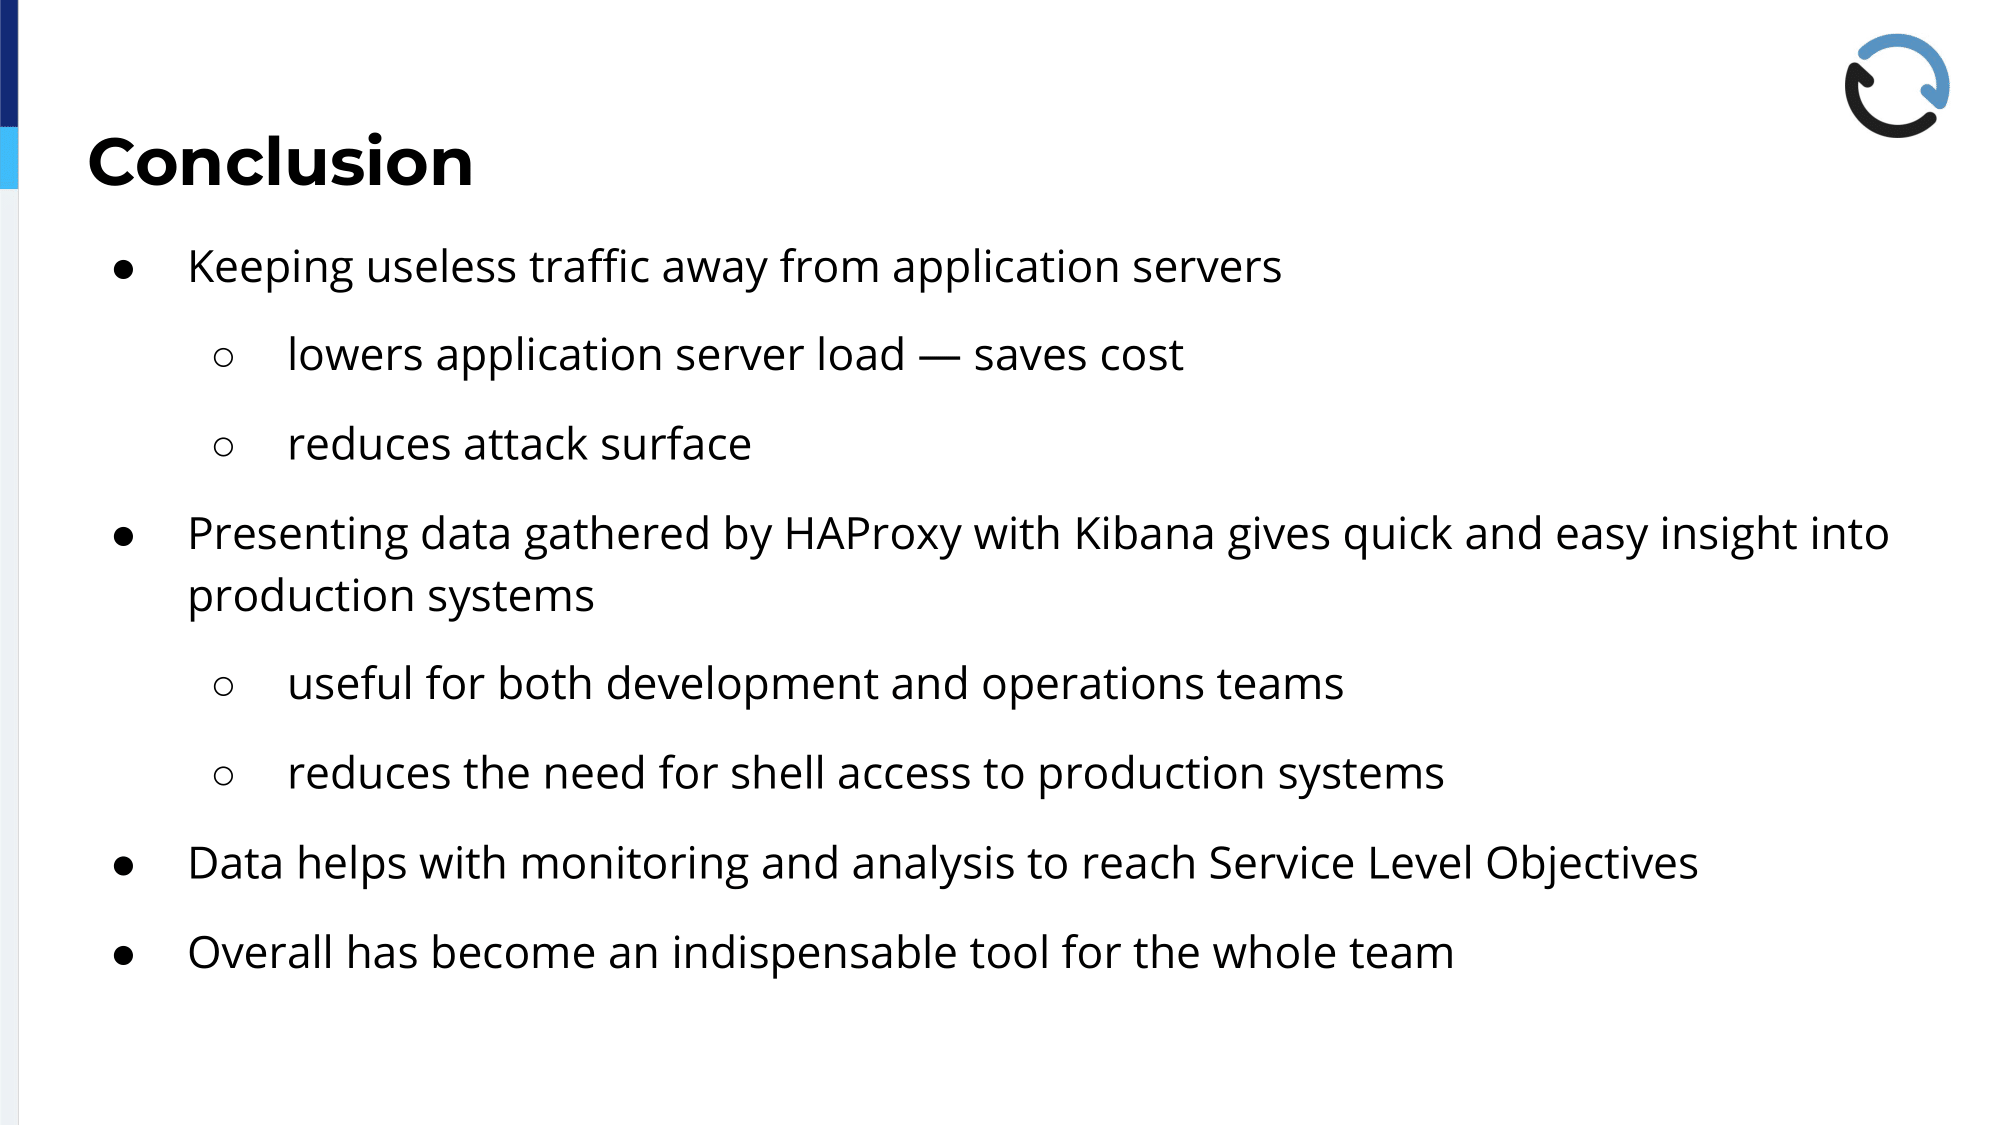
Now that we have all this, what do we think about it? What do we like? What don’t we like? First of all, keeping all that useless traffic, that potentially dangerous traffic, away from the backend application servers is very helpful, mainly from two perspectives. First, it lowers the load on the application servers, which saves real money because the less requests that reach there, you can make the servers less or have a smaller instance that runs the software, so that actually saves real money when you’re on AWS.
Of course, it reduces the attack surface. If we know what we can filter out early on will never reach it, we can make more educated decisions on what kinds of attacks might actually happen. Of course, it doesn’t replace a good patch hygiene, so you still need to make sure that your backend servers are up to date because in the end you want some traffic to reach them, and that might still be malicious, but at least it’s a plus.
Presenting the data gathered by HAProxy, in this case in that Kibana interface, in that visual style, that gives a quick and easy, especially easy, insight into the production system. That is useful for both the Ops team and the developers. As I said, it makes it very easy and low friction to open this up when you’re hunting down a bug and just do the research and filter quickly, and that is just a big benefit. Of course, it reduces the need to log into any servers via SSH. Usually, developers wouldn’t be allowed to do that anyway, but also every time I don’t have to log into something, that is one time I have no chance to break something.
The data helps with monitoring and analysis for the service level objectives; So that’s pretty important because we are certified in such and such ways; That makes it easy to provide documentation that we actually did this, also for historical data. Quite overall, it’s become an indispensable tool. We wouldn’t want to miss it any day.
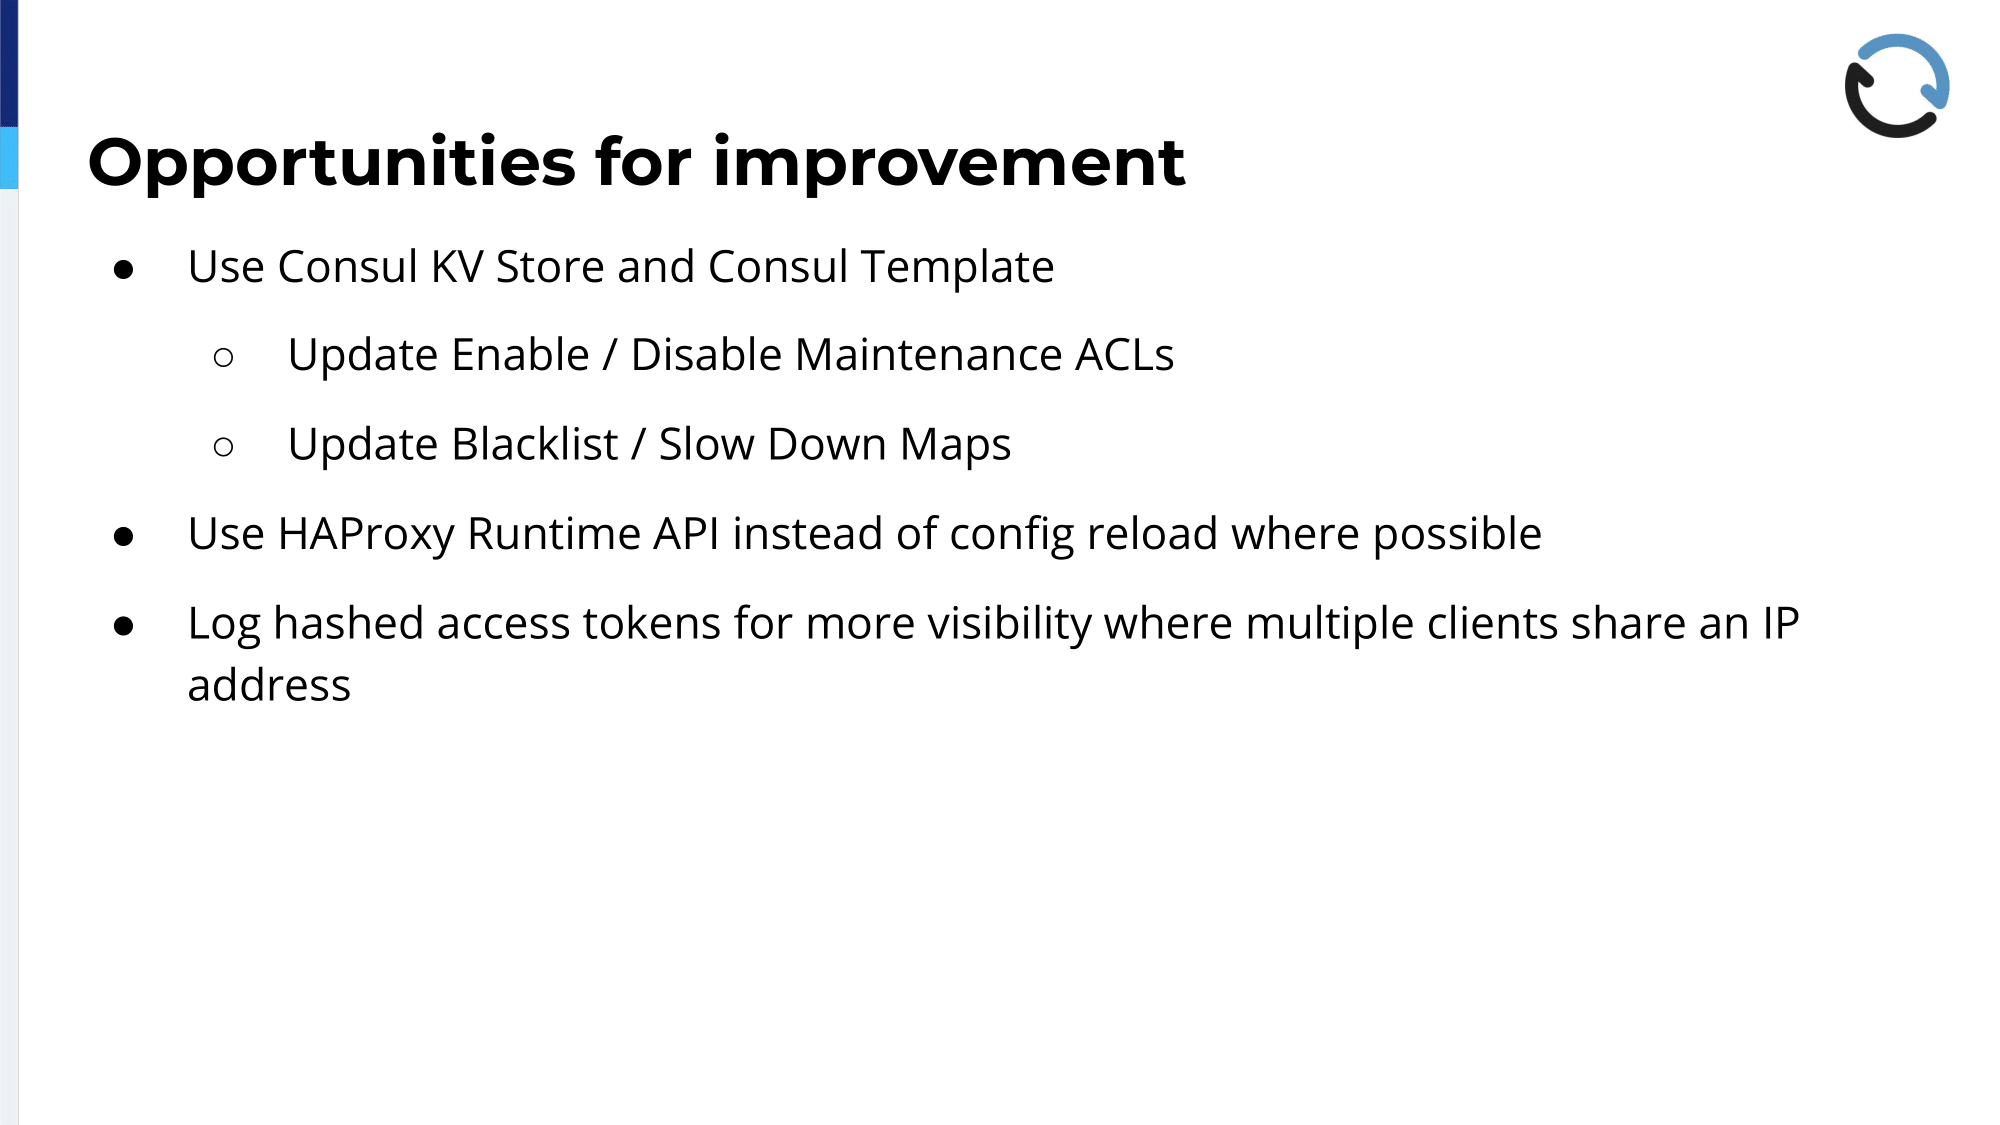
Because we are never really done and never really happy, there are at least some ideas that we still want to pursue in the future. One of them is that we want to use Consul, its key-value store. As I said earlier, we’re just using it for service discovery right now, but not as a key-value store, but that’s just a missed opportunity in my opinion and we plan to use that to update maps, especially, in the HAProxy configuration. For example, if a customer contacts us and says, “My password has been leaked. I used the same one and it was part of the last Adobe leak,” for example, we might want to reject these tokens that are connected to it or any other reasons. So, this is, right now, it’s done by triggering some Ansible scripts that will connect to the instance and do that sometimes, reload the configuration, so that’s something we want to avoid. The idea there is to have Consul and Consul Template just watch for changes to these two particular keys and, once that happens, use the Runtime API, the admin socket, and update the running HAProxy configuration on the fly, preventing these reloads.
We also had that earlier in TCP mode. At some points, you lose connections because after a while—I think it’s configured to three or five minutes or something—we hard stop all instances of all the HAProxy processes that remain handling old connections when you reload and exactly the same example as with Vimeo this morning, when someone is uploading or downloading a big file, that time might just not be enough and we will interrupt that connection and that’s just a bad experience, so we try to get away from that model.
The last one that is currently not part of the data that we log and which we would like to have, is some way to discern individual users, even if they come from the same IP, especially corporate environments. If everything comes through one firewall, one net gateway, it looks like a single IP, but it’s, in many cases, it’s obviously multiple users. Especially when you’re trying to figure out why something’s going wrong, it would be helpful to be able to say, okay, this request and this request and this request, but not the 51 in between, are from a single person. We are thinking about doing that by having HAProxy hash the Authorization header value and then cut that down to like four or five characters maybe, and add that as another piece of information to the log.
Well, and with that, that’s all I have to tell for myself. If you have any questions, I’d be happy to answer them.