Enterprise modules
Real-time Dashboard
Deprecation notice
The Real-time Dashboard has been marked as deprecated and is scheduled for removal. HAProxy Enterprise 2.8 will be the last version to support it. Commands and examples on this page specify 2.8 as the version number, but they equally apply to earlier versions.
If you are looking for a replacement for the Real-time Dashboard, look no further than the HAProxy Fusion Control Plane. Manage your HAProxy Enterprise load balancers from a single graphical dashboard or a REST-based API.
The Real-time Dashboard is a web application that collects live metrics from your HAProxy Enterprise load balancers and displays them. You can also perform actions like disabling servers.
Although you can install the dashboard onto your own web server, we host it for you at https://dashboard.haproxy.com/.
Installation Jump to heading
The Real-time Dashboard is a web application that collects live metrics from your load balancers and displays them. You can also perform actions like disabling servers.
-
Use your system’s package manager to install the dashboard package onto your HAProxy Enterprise server:
nixsudo apt-get install hapee-2.8r1-lb-dashboardnixsudo apt-get install hapee-2.8r1-lb-dashboardnixsudo yum install hapee-2.8r1-lb-dashboardnixsudo yum install hapee-2.8r1-lb-dashboardnixsudo zypper install hapee-2.8r1-lb-dashboardnixsudo zypper install hapee-2.8r1-lb-dashboardnixsudo pkg install hapee-2.8r1-lb-dashboardnixsudo pkg install hapee-2.8r1-lb-dashboardThis installs the following components:
Component Description /etc/hapee-2.8/dashboard-module.cfgConfiguration that exposes a new endpoint within HAProxy Enterprise at port 9022. When a request arrives at this port, HAProxy Enterprise dispatches it to a Lua module that returns statistics for the dashboard to collect. /opt/hapee-2.8/dashboard/dashboard-module/Folder that contains the Lua module that generates HAProxy Enterprise statistics. It contains dashboard.luac, the Lua module for statistics anddashboard-config.lua, the configuration file that defines a cluster of HAProxy Enterprise nodes from which to gather statistics./opt/hapee-2.8/dashboard/dashboard/Folder that contains the web application for the dashboard. -
Copy the folder
/opt/hapee-2.8/dashboard/dashboardto your web server to host it on an IP address and port of your choosing. Consult your web server’s instructions for hosting static files.Info
Because the dashboard starts without any data, you can use the one we host on haproxy.com. Go to
https://dashboard.haproxy.comto access your hosted dashboard.To give you an example of hosting the dashboard yourself, you can use the following Python commands to start a rudimentary web server directly from the dashboard directory:
nixcd /opt/hapee-2.8/dashboard/dashboardpython3 -m http.server 8000nixcd /opt/hapee-2.8/dashboard/dashboardpython3 -m http.server 8000Open the Real-time Dashboard at port 8000 using your web browser.
-
You must configure the dashboard to fetch metrics data from HAProxy Enterprise. You have two options:
- Configure the Lua module
- Configure the Dashboard Gateway
Lua module Jump to heading
The dashboard package you used to install the dashboard UI also includes a Lua module that returns HAProxy Enterprise statistics. It allows the Real-time Dashboard to display live data.
Enable metrics for a single node Jump to heading
-
Edit the configuration file:
- On Debian/Ubuntu,
/etc/default/hapee-2.8-lb - On Alma/Oracle/Red Hat/Rocky,
/etc/sysconfig/hapee-2.8-lb
Change the OPTIONS line so that it contains the following
-fargument, which loads thedashboard-module.cfgfile when the HAProxy Enterprise service starts:hapee-VERSION-lbtextOPTIONS="-f /etc/hapee-2.8/dashboard-module.cfg"hapee-VERSION-lbtextOPTIONS="-f /etc/hapee-2.8/dashboard-module.cfg"The
dashboard-module.cfgfile starts a new listener at port 9022 that exposes metrics data. This data comes from an applet defined in the Dashboard Lua module located in/opt/hapee-2.8/dashboard/dashboard-module. - On Debian/Ubuntu,
-
Restart the HAProxy Enterprise service for the change to take effect:
nixsudo systemctl restart hapee-2.8-lbnixsudo systemctl restart hapee-2.8-lb -
Open the dashboard in your browser. Click the Settings button to display the Settings window.
-
Set Data Source to Real-time Dashboard Module.
-
Set Data Source Mode to Single Node and close the window.
-
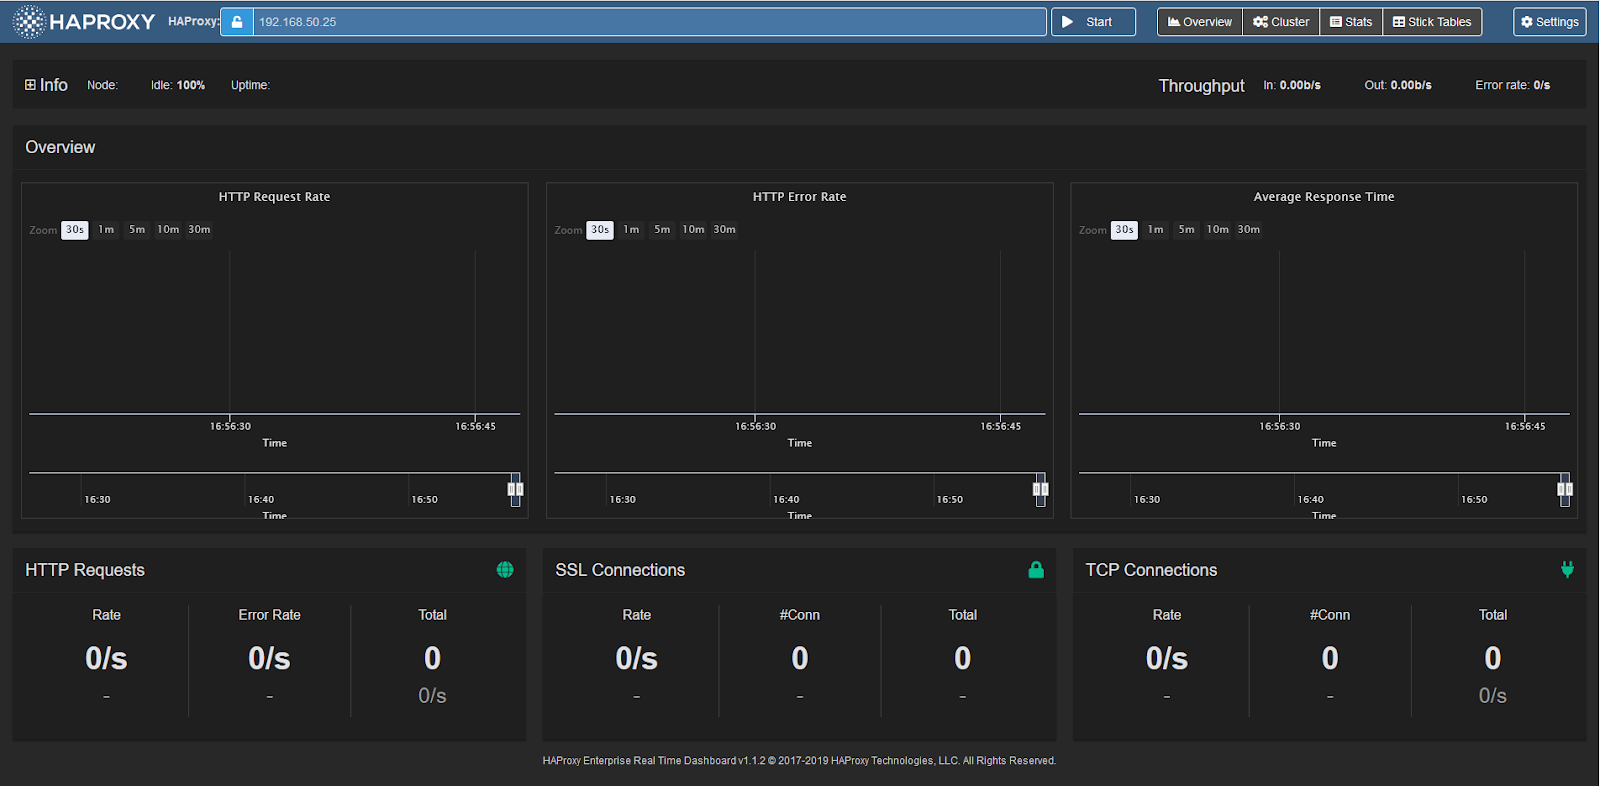
At the top of the Real-time Dashboard is the header bar, which display the address from where it fetches statistics. Change the URL to be the address of your HAProxy Enterprise node. You do not need to specify a port. The port defaults to 9022, so you do not need to set it here. If the address is already correct, you do not need to change it.
-
Click the Start button to complete setup.
Enable metrics for multiple nodes Jump to heading
Optionally, you can connect to data feeds from multiple HAProxy Enterprise nodes running on different servers:
-
On each HAProxy Enterprise server, install the Real-time Dashboard.
-
Edit the configuration file to enable metrics. See Enable metrics for a single node.
-
Choose one server to act as the “aggregation primary” node. On that server, update the file
/opt/hapee-2.8/dashboard/dashboard-module/dashboard-config.lua. Initially, it contains the following empty configuration:dashboard-config.lualuaconf = {cluster = {nodes = nil,master = false}}dashboard-config.lualuaconf = {cluster = {nodes = nil,master = false}} -
Add the IP address and port of each HAProxy Enterprise node to the
nodesproperty. Also, set themasterproperty totrue:dashboard-config.lualuaconf = {cluster = {nodes = {"192.168.50.25:9022","192.168.50.26:9022","192.168.50.27:9022",},master = true}}dashboard-config.lualuaconf = {cluster = {nodes = {"192.168.50.25:9022","192.168.50.26:9022","192.168.50.27:9022",},master = true}} -
Restart the HAProxy Enterprise service:
nixsudo systemctl restart hapee-2.8-lbnixsudo systemctl restart hapee-2.8-lb -
Open the Real-time Dashboard in your browser, then click the Settings button to display the Settings window.
-
Set Data Source to Real-time Dashboard Module.
-
Set Data Source Mode to Cluster Aggregation and close the window.
-
Click the Start button to complete setup.
Set HTTP basic authentication Jump to heading
When you enable HTTP basic authentication in the file dashboard-module.cfg, the Real-time Dashboard Lua module’s API is restricted to certain users. By default, the configuration defines a user named “dashboard” with the password “test”. Change the username and password, and update the Real-time Dashboard’s settings to match.
-
Use
mkpasswdto create an SHA-2 password:nixmkpasswd -m SHA-256nixmkpasswd -m SHA-256Info
If
mkpasswdis not present on your OS, it can be installed by downloading thewhoispackage on most Linux distributions; on Red Hat you may have to explicitly install it viasudo yum install mkpasswd. -
Edit the configuration file
/etc/hapee-2.8/dashboard-module.cfg2to change the dashboard_usersuserlistsection so that it contains oneuserline to define a username and encrypted password. -
Add the password to the
userline, and restart the HAProxy Enterprise service:nixsudo systemctl restart hapee-2.8-lbnixsudo systemctl restart hapee-2.8-lb -
Open the Real-time Dashboard in your browser and click the Settings button to display the Settings window. Set the Username and Password values to match.
Enable HTTPS between the Dashboard UI and HAProxy Enterprise Jump to heading
The UI fetches metrics from HAProxy Enterprise. To encrypt this communication, you must enable HTTPS.
-
Obtain a valid TLS certificate for the node where you are running HAProxy Enterprise. This is the aggregation primary node when you run multiple HAProxy Enterprise nodes.
-
Save it to
/etc/hapee-2.8/certs. -
Edit the file
/etc/hapee-2.8/dashboard-module.cfgto remove the following line from thelisten dashboardsection:haproxybind *:9022haproxybind *:9022 -
Replace it with the following line, changing
site.pemto be name of your TLS certificate:haproxybind *:9023 ssl crt /etc/hapee-2.8/certs/site.pemhaproxybind *:9023 ssl crt /etc/hapee-2.8/certs/site.pem -
Restart the HAProxy Enterprise service:
nixsudo systemctl restart hapee-2.8-lbnixsudo systemctl restart hapee-2.8-lb -
Open the Real-time Dashboard in your browser and change the address in the header bar to be the hostname that matches the TLS certificate’s CN value. Click the padlock icon to turn it green.
-
Click the Start button to complete setup.
Info
If you use a self-signed certificate, you must either import it into your workstation’s trusted certificate store, or accept it as an untrusted certificate in your browser. To do so, open a new tab and enter the URL to the API, such as https://lb1.test.com:9023/dashboard/info, and accept the certificate.
Dashboard Gateway Jump to heading
The Dashboard Gateway is an alternative to the Real-time Dashboard Lua module and works with all versions of HAProxy. It collects metrics data from one or several HAProxy Enterprise nodes and exposes it for the Dashboard Gateway to use. By default, it runs an API at port 9020.
Before proceeding, install the dashboard-gateway package depending on your operating system:
nix
nix
nix
nix
nix
nix
nix
nix
Enable metrics for a single node Jump to heading
-
Edit your HAProxy Enterprise configuration file to add a
stats socketdirective in theglobalsection.This enables the HAProxy Runtime API used to fetch metrics. The IP address is
127.0.0.1and the port is9024. You must set theleveltoadminso that the Dashboard Gateway can manage the HAProxy Enterprise node, as follows:haproxyglobalstats socket ipv4@127.0.0.1:9024 level adminhaproxyglobalstats socket ipv4@127.0.0.1:9024 level admin -
Restart HAProxy:
nixsudo systemctl restart hapee-2.8-lbnixsudo systemctl restart hapee-2.8-lb -
Copy the
config.json.exampleconfiguration file and rename itconfig.json.See Configure the Dashboard Gateway for more details.
nixcd /opt/hapee-2.8/dashboard/dashboard-gateway/confsudo cp config.json.example config.jsonnixcd /opt/hapee-2.8/dashboard/dashboard-gateway/confsudo cp config.json.example config.jsonBy default, this file contains the following:
config.jsonjson{"isLogging": true,"logFile": "access.log","defaultHandler": "socket","defaultHostSSL": false,"nodes": [{"host": "127.0.0.1","port": "9024"}]}config.jsonjson{"isLogging": true,"logFile": "access.log","defaultHandler": "socket","defaultHostSSL": false,"nodes": [{"host": "127.0.0.1","port": "9024"}]} -
Start the Dashboard Gateway:
nixsudo systemctl enable hapee-2.8-lb-dashboard-gatewaysudo systemctl start hapee-2.8-lb-dashboard-gatewaynixsudo systemctl enable hapee-2.8-lb-dashboard-gatewaysudo systemctl start hapee-2.8-lb-dashboard-gateway -
Open the Real-time Dashboard in your browser and click the Settings button to display the Settings window.
-
Set Data Source to Real-time Dashboard Gateway.
-
Set Data Source Mode to Single Node.
-
Set Real-time Dashboard Gateway URL to the URL where the Dashboard Gateway is running. The port defaults to 9020. If you have configured it to use HTTPS, click the padlock icon to make it green, and close the window.
-
Change the URL in the header bar to the address of your HAProxy Enterprise node’s socket. The port defaults to 9024, so you do not need to set it here.
-
Click the Start button to complete setup.
Enable metrics for multiple nodes Jump to heading
Optionally, you can connect to data feeds from multiple HAProxy Enterprise nodes running on different servers:
-
On each HAProxy Enterprise server, edit the HAProxy Enterprise configuration file to add a
stats socketdirective in theglobalsection. -
Give an IP address that the server running Dashboard Gateway can reach, or an asterisk (*) to listen on all IP addresses:
haproxyglobalstats socket ipv4@*:9024 level adminhaproxyglobalstats socket ipv4@*:9024 level admin -
Restart HAProxy:
nixsudo systemctl restart hapee-2.8-lbnixsudo systemctl restart hapee-2.8-lb -
Choose one server to be the “aggregation primary” node. On that server, ensure that the
dashboard-gatewaypackage is installed. -
Make a copy of the
config.json.exampleconfiguration file and rename itconfig.json.nixcd /opt/hapee-2.8/dashboard/dashboard-gateway/confsudo cp config.json.example config.jsonnixcd /opt/hapee-2.8/dashboard/dashboard-gateway/confsudo cp config.json.example config.json -
Update the file
config.jsonso that itsnodessection lists each HAProxy Enterprise node’s IP address and port.See Configure the Dashboard Gateway for more details.
config.jsonjson{"isLogging": true,"logFile": "access.log","defaultHandler": "socket","defaultHostSSL": false,"nodes": [{"host": "127.0.0.1","port": 9024},{"host": "192.168.50.26","port": 9024}]}config.jsonjson{"isLogging": true,"logFile": "access.log","defaultHandler": "socket","defaultHostSSL": false,"nodes": [{"host": "127.0.0.1","port": 9024},{"host": "192.168.50.26","port": 9024}]} -
Start or restart the Dashboard Gateway:
nixsudo systemctl enable hapee-2.8-lb-dashboard-gatewaysudo systemctl start hapee-2.8-lb-dashboard-gatewaynixsudo systemctl enable hapee-2.8-lb-dashboard-gatewaysudo systemctl start hapee-2.8-lb-dashboard-gateway -
Open the Real-time Dashboard in your browser and click the Settings button to display the Settings window.
-
Set Data Source to Real-time Dashboard Gateway.
-
Set Data Source Mode to Cluster Aggregation.
-
Set Real-time Dashboard Gateway URL to the URL where the Dashboard Gateway is running.
If you have configured it to use HTTPS, click the padlock icon to make it green. Then, close the window.
-
Click the Cluster button to display the Cluster Setup window.
Check that all nodes are listed. Then, click Use Cluster to complete setup.
Configure the Dashboard Gateway Jump to heading
You can enable various settings for the Dashboard Gateway in the configuration file /opt/hapee-2.8/dashboard/dashboard-gateway/conf/config.json. Make sure you restart the Dashboard Gateway service after making any change to this file. This section describes the available options.
Here is an example configuration:
config.jsonjson
config.jsonjson
The following table describes these options:
| Option | Description |
|---|---|
apiRoot |
URI path under which the /dashboard, /gateway, /cluster and other sub-paths are available. Default: / |
authChallenge |
Whether to show an HTTP Basic authentication challenge when accessing the API. Note that you can enable Basic authentication by setting skipBasicAuth to false, but not show a prompt. Default: false |
authRealm |
Realm for HTTP Basic authentication. Default: “HAProxy Enterprise Real-time Dashboard Gateway” |
defaultHandler |
Default way for the gateway to connect to HAProxy. Either module or socket. Default: socket. |
defaultHost |
Default hostname or IP address the gateway uses to connect to HAProxy. Default: 127.0.0.1. |
defaultHostPort |
Default port the gateway uses to connect to HAProxy. Defaults to one of the following values: 9022 (HTTP), 9023 (HTTPS), 9024 (TCP), 9025 (TCP with TLS). |
defaultHostSSL |
Whether to use encryption when communicating with HAProxy. Default: false. |
defaultModulePassword |
Default Lua module password to use when connecting to nodes running the Dashboard Lua module. |
defaultModuleUser |
Default Lua module username to use when connecting to nodes running the Dashboard Lua module. |
disableHttp |
Whether to disable serving the gateway API over HTTP. Default: false. |
disableHttps |
Whether to disable serving the gateway API over HTTPS. When set to false, you must also set httpsCertFile and httpsKeyFile. Default: true. |
httpsCertFile |
Path to the SSL certificate file when serving the gateway API over HTTPS. You must set disableHttps to false to enable HTTPS. If you use a relative path, ./ and ./cert will be searched. Default: cert.pem. |
httpsKeyFile |
Path to the SSL key file when serving the gateway API over HTTPS. You must set disableHttps to false to enable HTTPS. If you use a relative path, the API searches for ./ and ./cert. Default: key.pem. |
httpPort |
HTTP port where the gateway listens. Default: 9020. |
httpsPort |
HTTPS port where the gateway listens. Default: 9021. |
isLogging |
Whether to log to a file in addition to stdout/stderr. Default: false. |
logFile |
Path to the log file. Default: “”. |
tlsPassphrase |
TLS passphrase for the certificate specified in httpsCertFile and httpsKeyFile. Default: “”. |
skipBasicAuth |
Disable HTTP Basic authentication when accessing the gateway API. Default: false. |
nodes |
Collection of HAProxy Enterprise nodes that the gateway communicates with to get metrics. |
The nodes collection has the following options:
| Option | Description |
|---|---|
host |
The hostname or IP address the gateway uses to connect to HAProxy. |
port |
The port that the gateway uses to connect to HAProxy. |
handler |
The way in which the gateway connects to HAProxy. Either module or socket. |
ssl |
Whether to use encryption when communicating with HAProxy. |
user |
To use when connecting Gateway to nodes running the Dashboard Lua module. |
password |
To use when connecting Gateway to nodes running the Dashboard Lua module. |
Enable HTTP Basic authentication Jump to heading
When you enable HTTP Basic authentication in the file config.json and set authChallenge to true, you restrict the Dashboard Gateway API to certain users. You can set one or more usernames and passwords.
-
The configuration file
/opt/hapee-2.8/dashboard/dashboard-gateway/conf/htpasswd.jsonhas the following format:htpasswd.jsonjson{"username_1": {"password": "sha256_password_hash","accessAll": "true"},"username_2": {// . . .},// . . .}htpasswd.jsonjson{"username_1": {"password": "sha256_password_hash","accessAll": "true"},"username_2": {// . . .},// . . .}For example, the default configuration is shown:
htpasswd.jsonjson{"dashboard": {"password": "9f86d081884c7d659a2feaa0c55ad015a3bf4f1b2b0b822cd15d6c15b0f00a08","accessAll": true}}htpasswd.jsonjson{"dashboard": {"password": "9f86d081884c7d659a2feaa0c55ad015a3bf4f1b2b0b822cd15d6c15b0f00a08","accessAll": true}}This adds the username dashboard with a password of test.
-
Edit the file to change the existing username and password.
Use the following command to create the encrypted password:
nixecho -n "YOUR_PASSWORD" | sha256sumnixecho -n "YOUR_PASSWORD" | sha256sum -
Open the Real-time Dashboard in your browser and click the Settings button to display the Settings window. Set the Username and Password values to match those you just configured.
Enable HTTPS between the aggregation primary and child nodes Jump to heading
The aggregation primary node fetches metrics from multiple HAProxy Enterprise nodes. To encrypt this communication, you must enable HTTPS.
-
Obtain a valid TLS certificate for each HAProxy Enterprise child node.
-
Make sure that the certificate is in PEM format.
Then, combine the private key and the public certificate into a single PEM file. Copy it to the node under the path
/etc/hapee-2.8/certs. -
Edit the node’s HAProxy Enterprise configuration file.
In the
globalsection, add ansslandcrtparameter to thestats socketdirective. Also, change its port to 9025:haproxyglobalstats socket ipv4@*:9025 level admin ssl crt /etc/hapee-2.8/certs/site.pemhaproxyglobalstats socket ipv4@*:9025 level admin ssl crt /etc/hapee-2.8/certs/site.pem -
On the aggregation primary node, edit the file
/opt/hapee-2.8/dashboard/dashboard-gateway/conf/config.json.For each node where you want to enable TLS, set
hostto the node’s FQDN so that it matches the certificate; Setportto 9025; Setsslset totrue.config.jsonjson{"isLogging": true,"logFile": "access.log","defaultHandler": "socket","defaultHostSSL": false,"nodes": [{"host": "127.0.0.1","port": 9024},{"host": "lb2.test.com","port": 9025,"ssl": true}]}config.jsonjson{"isLogging": true,"logFile": "access.log","defaultHandler": "socket","defaultHostSSL": false,"nodes": [{"host": "127.0.0.1","port": 9024},{"host": "lb2.test.com","port": 9025,"ssl": true}]} -
Restart the Dashboard Gateway:
nixsudo systemctl restart hapee-2.8-lb-dashboard-gatewaynixsudo systemctl restart hapee-2.8-lb-dashboard-gateway
Enable HTTPS between the Dashboard UI and the Dashboard Gateway Jump to heading
The UI fetches metrics from the Dashboard Gateway. To encrypt this communication, you must enable HTTPS.
-
Obtain a valid TLS certificate for the node where you are running the Dashboard Gateway.
This will be the aggregation primary node if running multiple HAProxy Enterprise nodes.
-
Make sure that the certificate and private key files are in PEM format.
Copy both the certificate and key files to the path
/opt/hapee-2.8/dashboard/dashboard-gateway. These should be made available before restarting the Dashboard Gateway. -
Edit the file
/opt/hapee-2.8/dashboard/dashboard-gateway/conf/config.json.- Set
disableHttpstofalse - Set
httpsCertFileto the path to the certificate file - Set
httpsKeyFileto the path to the key file.
config.jsonjson{"isLogging": true,"logFile": "access.log","defaultHandler": "socket","defaultHostSSL": false,"disableHttps": false"httpsCertFile": "cert.pem","httpsKeyFile": "key.pem","nodes": [{"host": "127.0.0.1","port": 9024},{"host": "lb2.test.com","port": 9025,"ssl": true}]}config.jsonjson{"isLogging": true,"logFile": "access.log","defaultHandler": "socket","defaultHostSSL": false,"disableHttps": false"httpsCertFile": "cert.pem","httpsKeyFile": "key.pem","nodes": [{"host": "127.0.0.1","port": 9024},{"host": "lb2.test.com","port": 9025,"ssl": true}]} - Set
-
Restart the Dashboard Gateway:
nixsudo systemctl restart hapee-2.8-lb-dashboard-gatewaynixsudo systemctl restart hapee-2.8-lb-dashboard-gateway -
Open the Real-time Dashboard in your browser and click the Settings button to display the Settings window.
-
Set Real-time Dashboard Gateway URL to the FQDN of the Dashboard Gateway so that it matches the TLS certificate (e.g.
dashboard-gateway.test.com:9021).Its port defaults to 9021, so you do not need to set it here.
-
Click the padlock icon in the Real-time Dashboard Gateway URL box so that it turns green. Then, click Close.
Using the dashboard Jump to heading
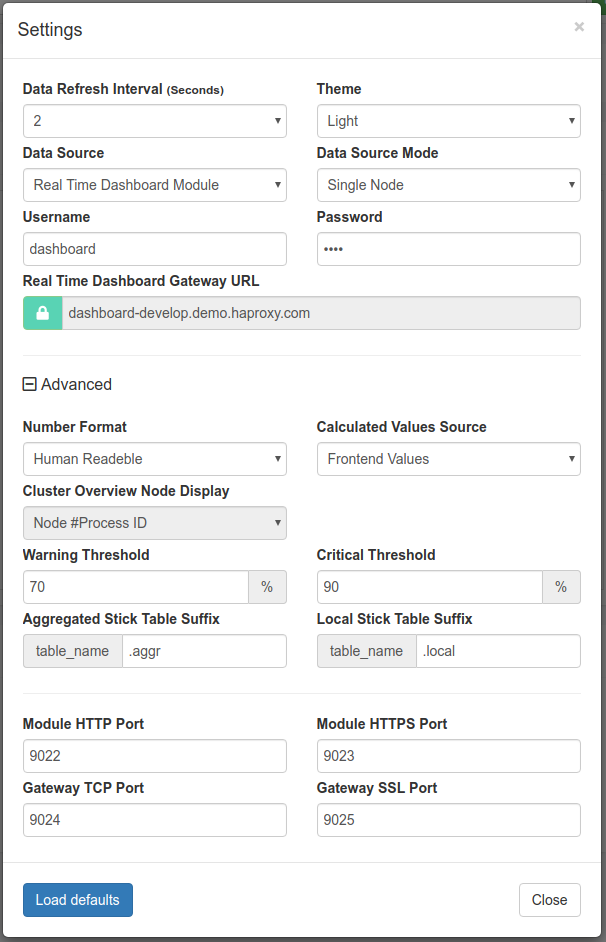
You configure the Real-time Dashboard in Settings at the top right of the header bar.
Real-time Dashboard saves these settings automatically in the browser’s local storage and they persist throughout page reloads and browser restarts.
-
You can modify the following settings:
Basic setting Description Data Refresh Interval Data refresh period. Theme GUI theme. Currently available themes are Dark (default) and Light. Data Source Real-time Dashboard module (default) or Real-time Dashboard Gateway. Data Source Mode Single Node: Real-time Dashboard requests and displays only the data from the module node it connects to, or the addressed node when the data source is Gateway. Cluster Aggregation: Real-time Dashboard requests and displays data from all HAProxy Enterprise nodes from which the module or Gateway was configured to aggregate data. Username Username for connecting to the Module or Gateway. Password Password for connecting to the Module or Gateway. Real-time Dashboard Gateway Address URL of the Real-time Dashboard Gateway (applicable when Data Source is set to Real-time Dashboard Gateway). Advanced setting Description Number Format Select between three different formats to display numerical values in Real-time Dashboard: Human Readable: formats values and adds SI order-of-magnitude suffixes (i.e. 1.26 kb/s). Formatted Values: inserts commas in the value and limits the number of decimal places (i.e. 1,261.00 b/s). Raw Values: displays the raw value from the statistics, except when Real-time Dashboard calculates the value, in which case it also limits the number of decimal places (i.e. 1261.00 b/s). Calculated Values Source Frontend Values: The values for graphs and Info Bar are summarized from the frontend block stats, errors are request errors. Backend Values: The values for graphs and Info Bar are summarized from the backend block stats, errors are response errors. Cluster Overview Node Display Determines the Node display format on Cluster Overview pane: Node #Process ID: i.e.my_server #2.Host:Port: i.e.127.0.0.1:9022.Warning Threshold For values on the Overview Pane with configured limits, this determines the percentage of the limit acting as a threshold over which values show a warning color (yellow). Default is 70%. Critical Threshold For values on the Overview Pane with configured limits, this determines the percentage of the limit acting as a threshold over which values show a critical color (red). Default is 90%. Aggregated Stick Table Suffix The suffix that the Global Profiling Engine takes on to denote the aggregated (i.e. to) stick tables. Default is .aggrLocal Stick Table Suffix The suffix that the Global Profiling Engine takes on to denote the source (i.e. from) stick tables. Default is .localModule HTTP Port Port number that Real-time Dashboard listens on by default for non-TLS HTTP connections. If there is no other value specified in the Header URL Box, this is the port number that Real-time Dashboard connects to. Default: 9022. Module HTTPS Port Port number where the Real-time Dashboard listens on by default for HTTPS connections (when the URL Box is in locked state). Default: 9023. Gateway TCP Port Port number where the HAProxy Enterprise Admin Socket listens on by default for non-TLS socket connections. This value gets relayed to the Dashboard Gateway if there is no other value specified in the URL Box. Default: 9024. Gateway SSL Port Port number where the HAProxy Enterprise Admin Socket listens on by default for TLS-encrypted socket connections (when the URL Box is in locked state. If there is no other port value given, this value gets relayed to the Dashboard Gateway). Default: 9025. -
Click Close to modify your settings.
-
Click Load defaults if you need to return to default settings.
Navigate around the Real-time Dashboard Jump to heading
The general layout of the application is split into two main sections. Header Bar, Info Bar and a pane displaying selected views below it.
Header bar Jump to heading
Located at the top of the screen, the header bar allows you to perform the following tasks:

To reload the page:
- Click on the HAProxy Enterprise Logo (1).
To enter the address of the HAProxy Enterprise node:
- In the URL Box (2), use a format similar to
[<http|https>://]domain|IP[:port][/path]. - The mandatory information is the domain name or IP address of the HAProxy Enterprise node. It defaults to the domain where the UI is hosted.
- You can omit http or https because this information is stored
- If you do not specify a port, Real-time Dashboard uses the default port
- If you enter a path, Real-time Dashboard appends the standard API endpoints (/dashboard or /cluster) to it
- The icon indicates whether the access to the HAProxy Enterprise node uses TLS encryption. This is a toggle function.
- If you connect to Real-time Dashboard over HTTPS, you cannot connect to an HAProxy Enterprise node with an unencrypted link; hence the toggle is disabled.
- If you connect to an HAProxy Enterprise node over HTTPS, we recommend that you use a valid SSL certificate. Invalid certificates (not trusted by the browser) cause Javascript calls to fail silently and return a Request Error message when you click on Servers Status.
To turn on or off data fetching:
- Click on the Start/Stop button (3). If you set the data refresh interval to Off in Settings, you can display an instantaneous update by clicking Refresh.
To display the overview:
- Click on Overview button (4).
To display the cluster overview:
- Click on Cluster button (5) Available only in Cluster Aggregation mode. In Single Mode, it displays the Cluster Setup Dialog (see below).
To display statistics:
- Click on Stats button (6).
To display stick tables:
- Click on Stick button (7).
To configure the Real-time Dashboard:
- Click Settings (8) to display configuration options.
Info Bar Jump to heading
The Info Bar contains general information about an node. In Cluster Aggregation mode, it displays nodes to which the Real-time Dashboard is connected.

When in Cluster Aggregation mode, the main view of the Info Bar displays aggregated information; to drill down to information for each node, click the + icon.
The Info bar gives the following information:
| Field | Description |
|---|---|
| Node | Host name of the node. A tool tip displays the PID, process number and version when hovering over Node. |
| Host | IP/Address and Port used to identify the Node in the Real-time Dashboard / Gateway. Displayed only in Cluster Aggregation drill-down. |
| Idle | Percentage of CPU idle time on the host. When hovering over this metric, a tool tip displays the CPU utilization of the HAProxy Enterprise node on the machine. |
| Uptime | HAPEE-LB service uptime to the moment in days, hours:min:secs, hours are given in 24-hour format. |
| In | Total Bytes In across all Frontends/Backends. You can select between Frontends or Backends as the source of this information in Settings. |
| Out | Total Bytes Out across all Frontends/Backends. Same as above. |
| Error rate | Total Errors divided by elapsed time across all Frontends/Backends. Same as above. |
Read metrics in Real-time Dashboard Jump to heading
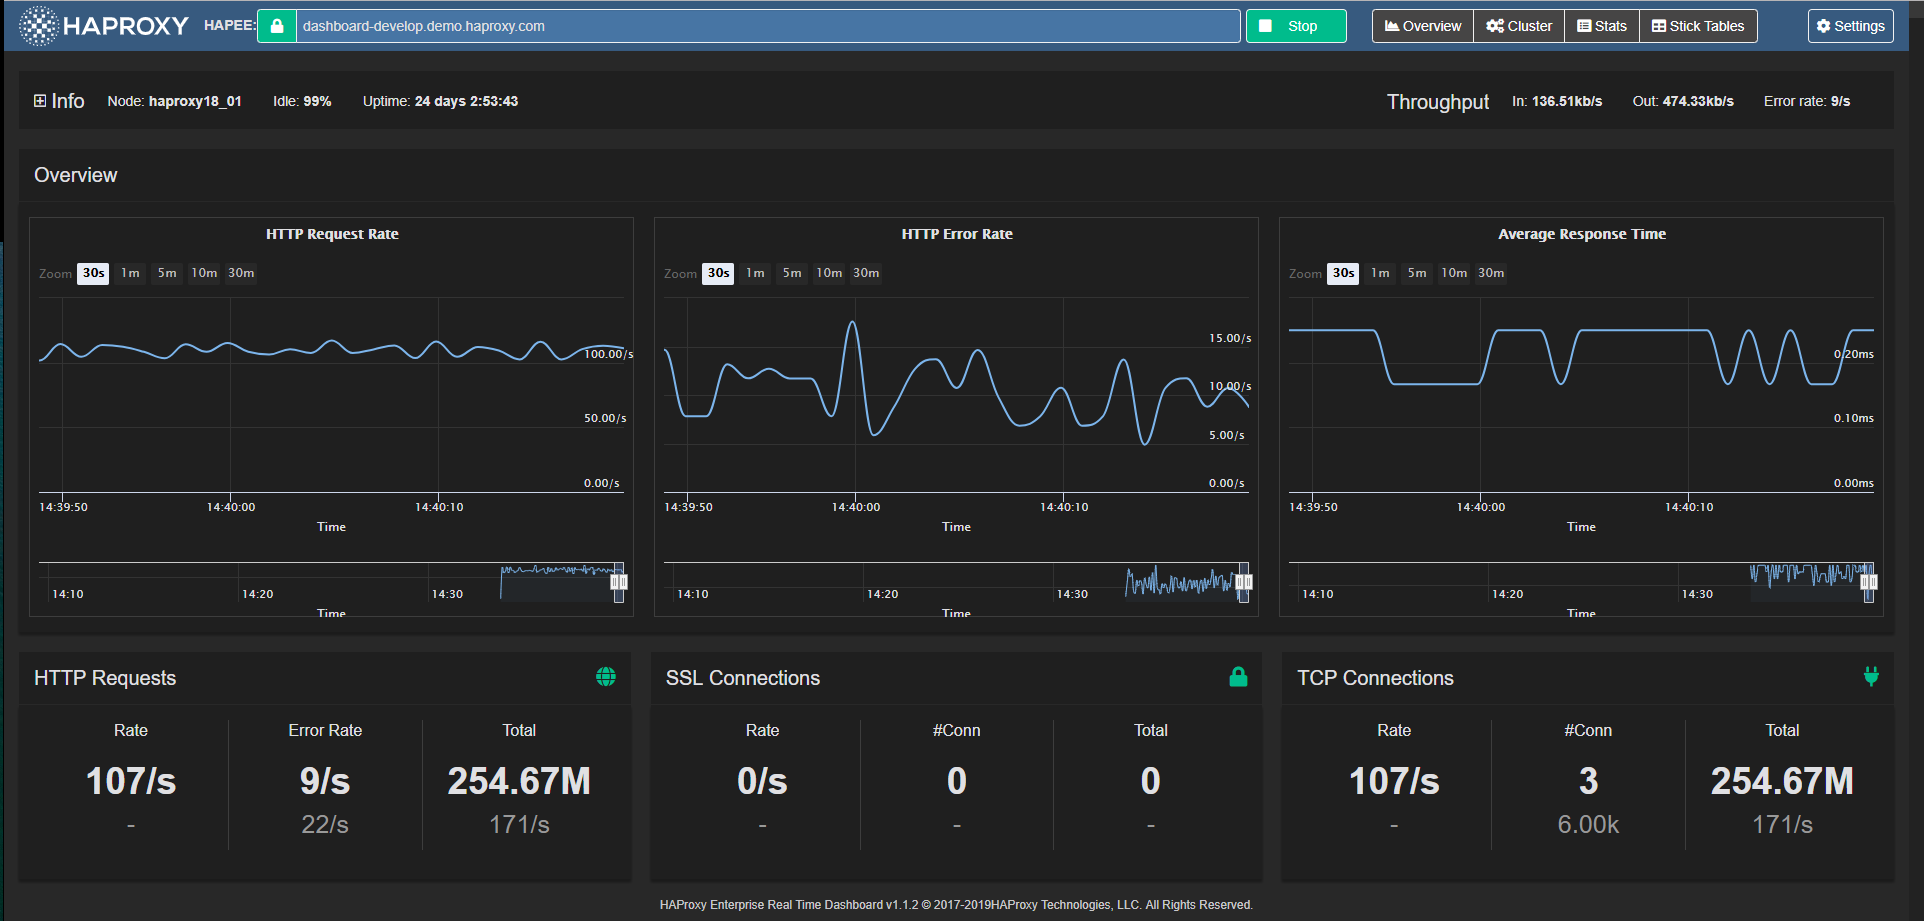
The Overview window is the initial view of the application. It displays the node-level (or cluster-level) summarized information, as well as key metric charts.
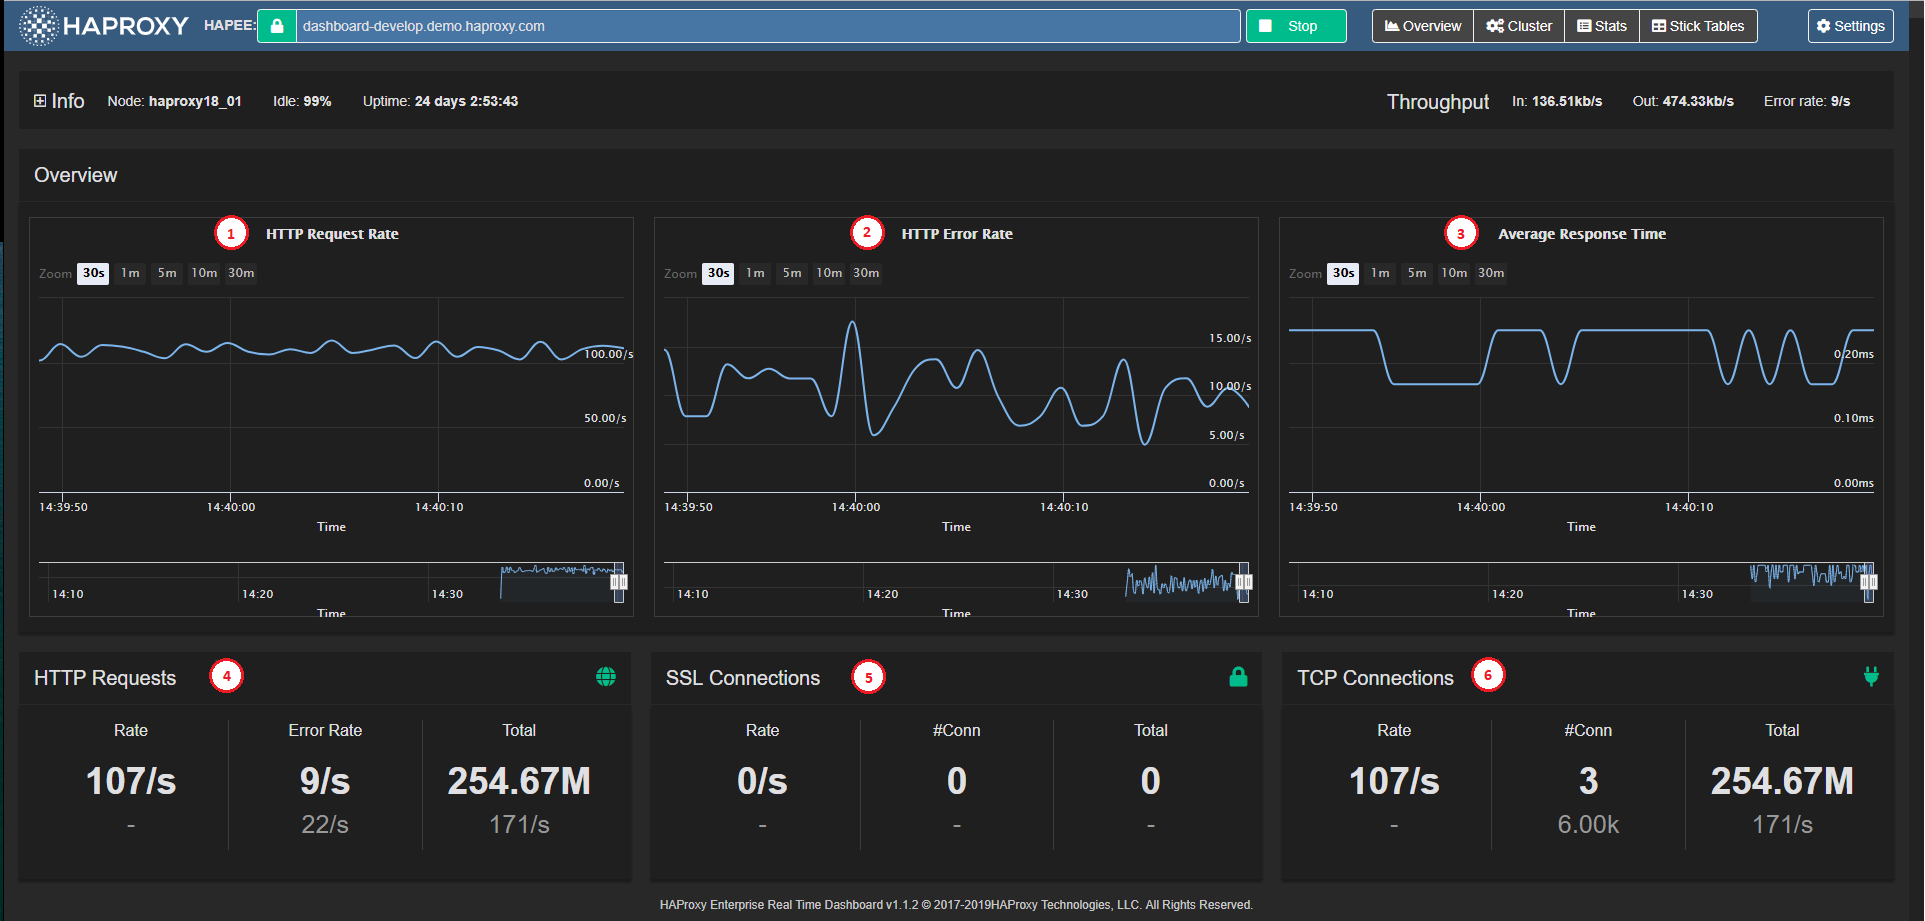
It contains the following elements:
HTTP Request Rate Chart (1) Charts the total HTTP request rate across the node (or across all nodes in Cluster Mode).
HTTP Error Rate Chart (2) Charts the total HTTP error rate across the node (or across all nodes in Cluster Mode).
Average Response Time Chart (3) Charts the average response time across the node (or across all nodes in Cluster Mode).
HTTP Requests Panel (4) Displays the node-level (or aggregate) HTTP Request related stats and limits.
SSL Connections Panel (5) Displays the node-level (or aggregate) SSL Connection related stats and limits.
TCP Connections Panel (6) Displays the node-level (or aggregate) TCP Connection related stats and limits.
Overview charts Jump to heading
The Overview graphs display information for HTTP traffic, average response time, and SSL/TCP connections.
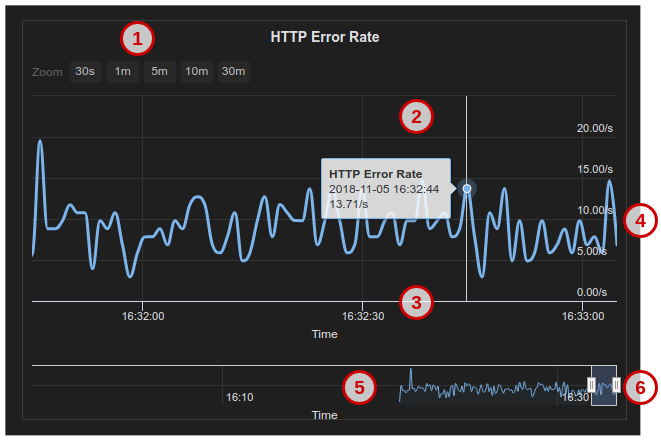
Zoom Level Selector (1) Sets five different zoom levels for the Main Chart Display (30 seconds, 1 minute, 3 minutes, 10 minutes, and 30 minutes) The zoom level is synchronized across all three Overview Graphs.
Main Chart Display (2) A tool tip appears when hovering over any chart point to show the detailed data point (time and value). This data point is synchronized across all three Overview Charts.
Time Axis (3) Horizontal axis is the data point event time axis
Value Axis (4) Vertical axis is the data-point values axis
Chart Navigator (5) Displays the local data history in a miniature view with its own time axis.
Navigator Handles (6) Focuses on a time period in the local history when you drag the handles. When you release the handle, the selected zoom level/period is synchronized across the three Overview Charts.
Read statistics in Real-time Dashboard Jump to heading
The Stats Pane presents individual Proxy (frontend, backend or listen block) statistics, as well as individual Server statistics in a table view.
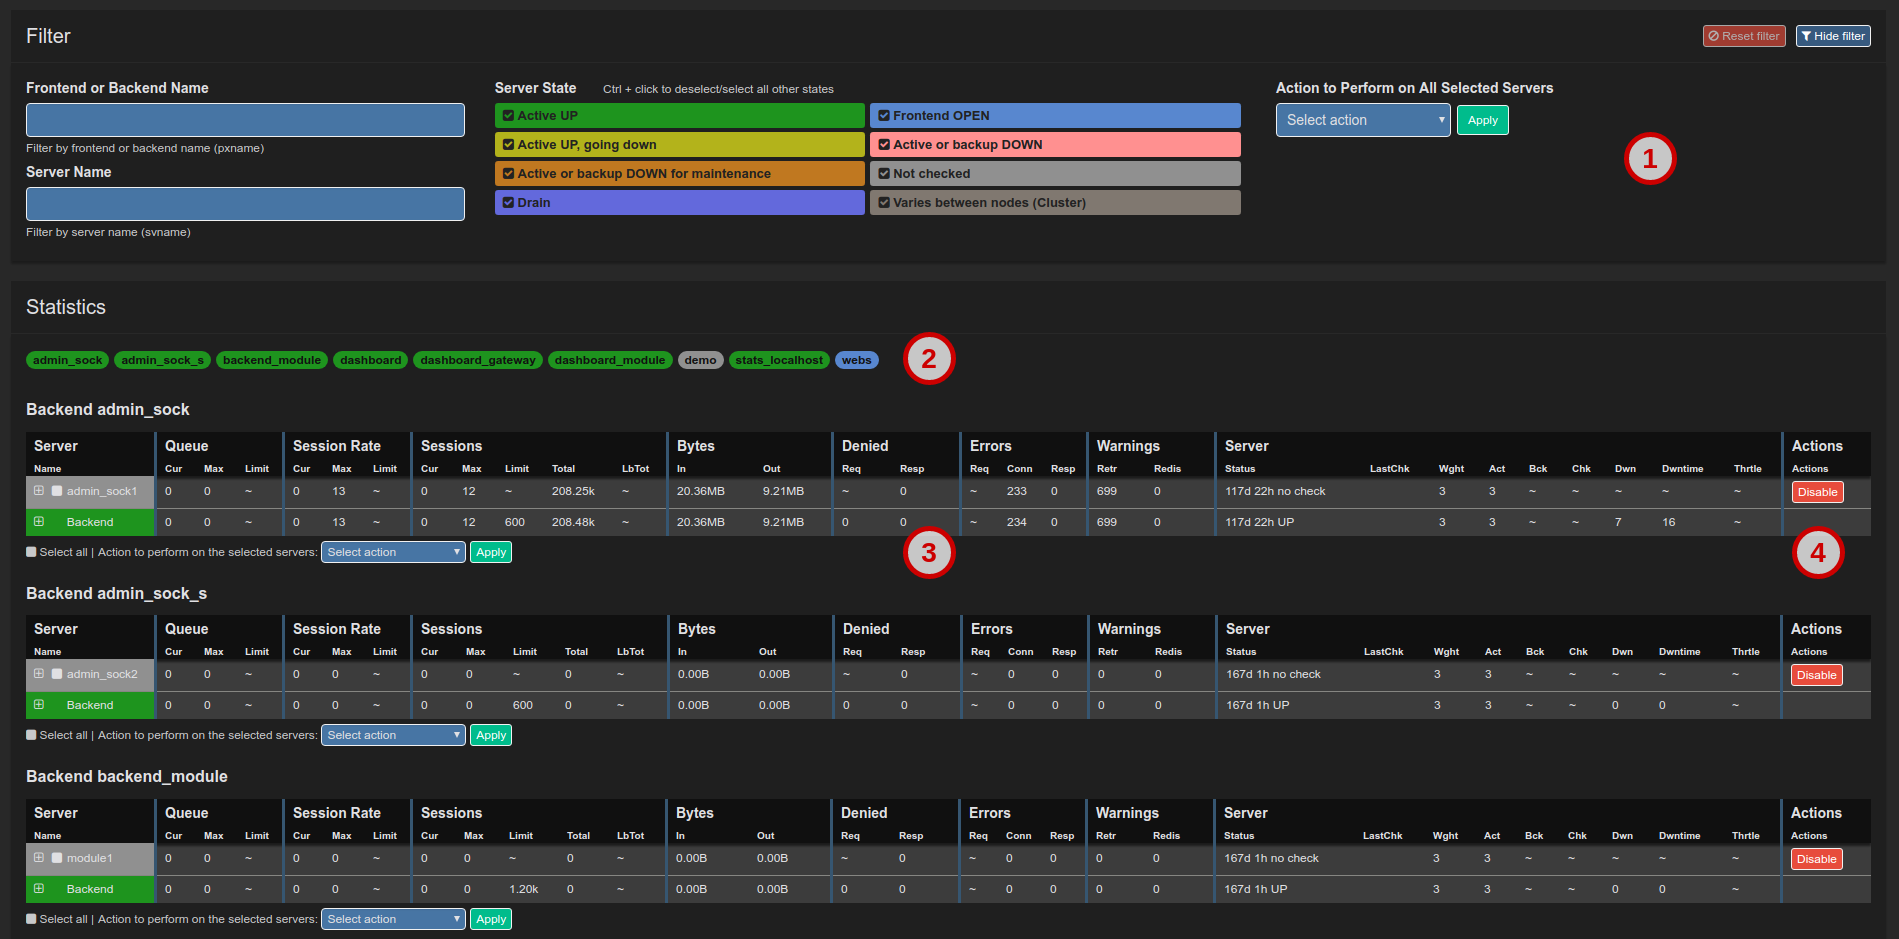
The Stats Pane consists of the following major sections:
Filter Block (1) See Set filter criteria
Quick Navigation buttons (2) Gives quick access to the selected Proxy on the screen.
Stats Tables (3) Proxy and Server statistics, see Stats Pane under Data Fields for more detailed data on statistics values.
Quick Action Buttons (4) See below
Stats table Jump to heading
The tables operate slightly differently depending on the Data Source Mode:
-
Single Node: Each server appears on one line, and its statistics and status come from the node to which Real-time Dashboard is connected.
-
Cluster Aggregation: Each server appears as a header line in gray with statistics and status aggregated across all the nodes that it contains.
Depending on the mode, Stats tables display the following information:
Proxy Name Real-time Dashboard infers from available server lines whether the block is a frontend, backend, or listen (or FE/BE pair with same name, which it treats as a listen block).
Server Names Name of the server
Statistics Columns Hover over each column heading to display additional information. If the server state is not up, the entire row takes on the Server State color, as used for Filter Block labels. See Stats Pane in the section Understanding data from Real-time Dashboard for more detailed data on statistics values.
Drill down for more information:
- Click the + icons to display statistics for each node (when in cluster mode)
Perform an administrative task:
-
Select a server or all servers in the proxy.
-
Choose an action from the drop-down list.
-
Click Apply.
Enable or disable proxy:
The Enable/Disable button on the right of the screen allows you to turn off the server for maintenance or turn it back on if it is down.
Read proxy and server states Jump to heading
The Cluster Overview displays with a matrix/“spreadsheet” overview of states of Proxies and Servers for each connected HAProxy Enterprise Node (see Dashboard Aggregation Cluster). The columns in the matrix represent the nodes (which can be HAProxy Enterprise nodes or processes).
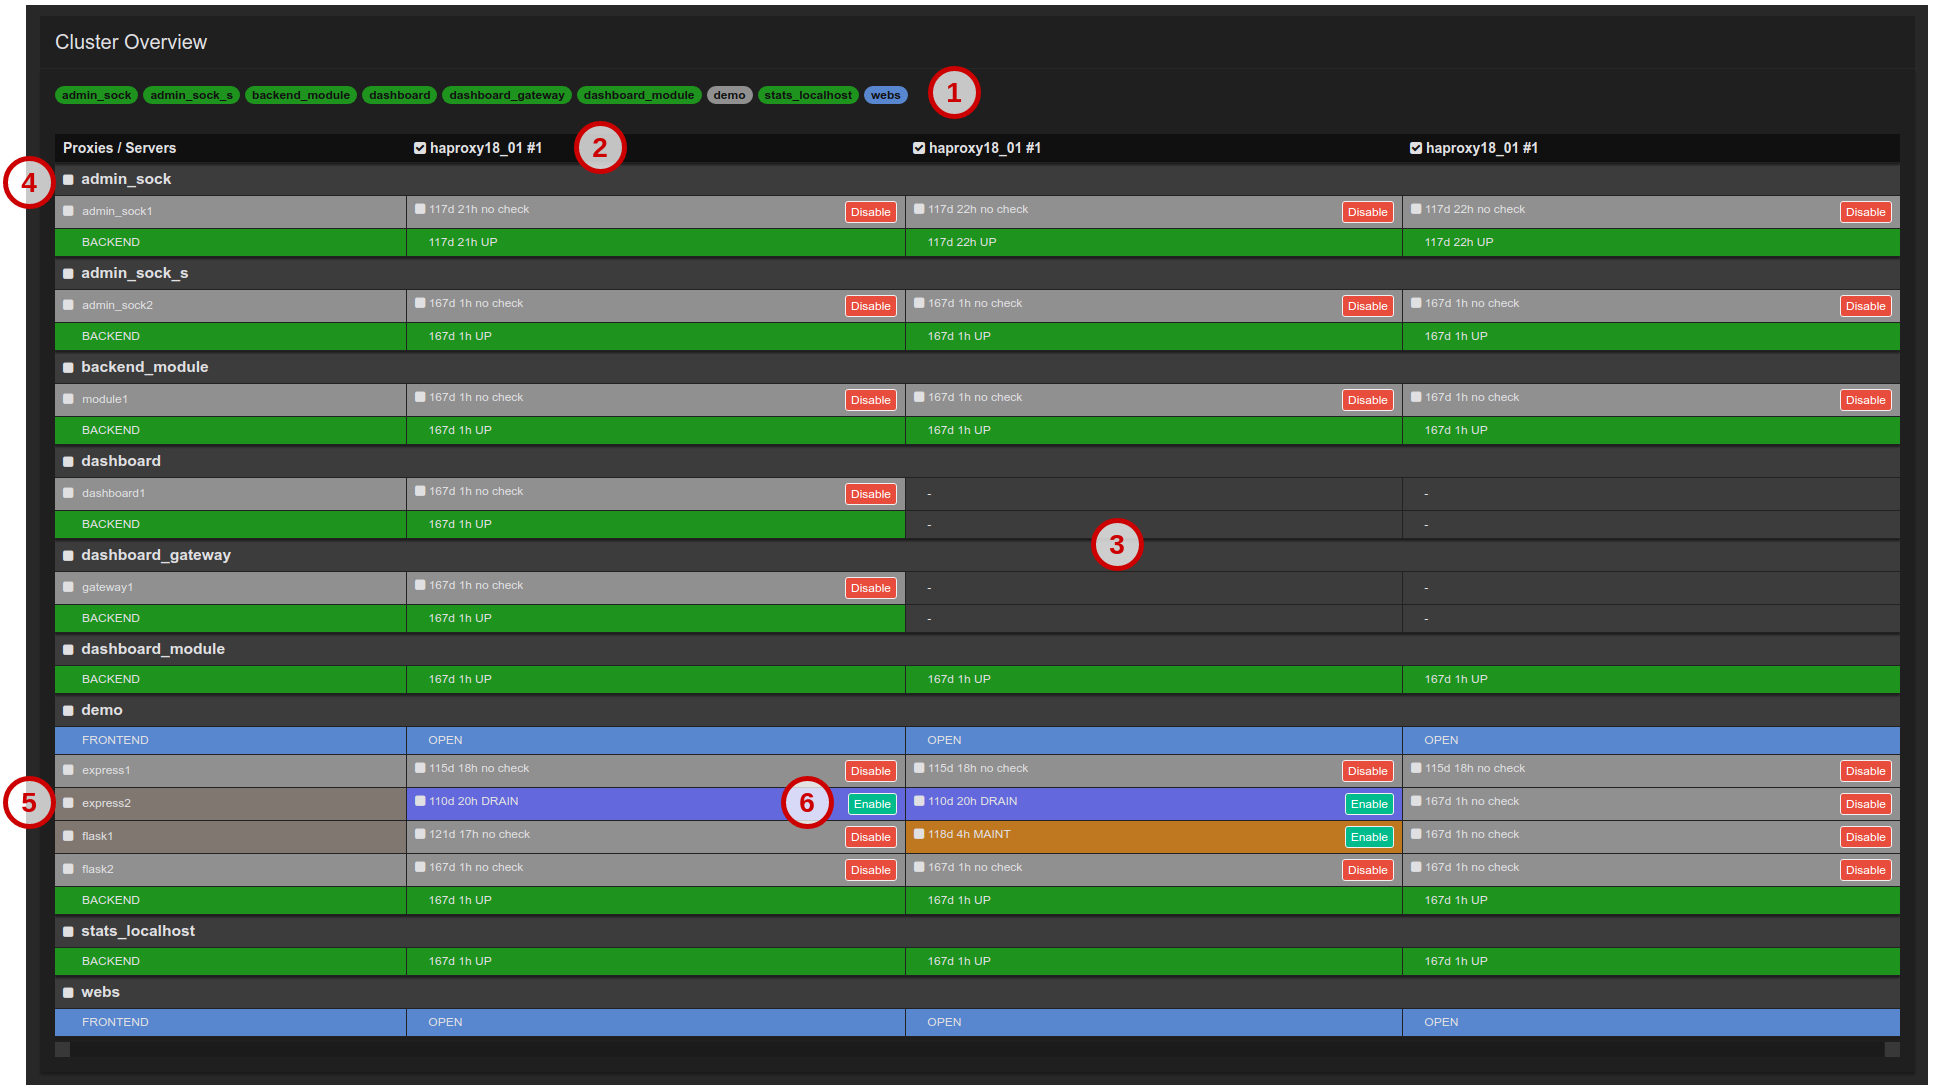
The key elements on the pane are:
Quick navigation buttons (1) Allows quick access to a server or proxy.
Cluster nodes (2) The rows in the matrix represent HAProxy Enterprise Nodes. The check boxes allow you to select a server or proxy on which to perform an administrative task.
Cluster Overview Matrix (3) Displays an overview of statuses for Proxies and Servers across Nodes. Servers that do not exist on specific nodes display an empty space (background color) in the matrix.
Proxy Rows (4) The rows are organized into Proxies containing Servers. The check boxes allow you to select a server or proxy on which to perform an administrative task.
Server Rows (5) The status color of the header column is medium-gray when the status for the server varies across nodes
Server Columns (6) Each cell (column) represents the Server status on that column’s node.
Set filter criteria Jump to heading
Filtering allows you to display or to perform administrative tasks on selected proxies (i.e. frontend, backend and/or listen blocks) in both Stats and Cluster panes.
The filter criteria persist when you switch between Stats and Cluster panes.
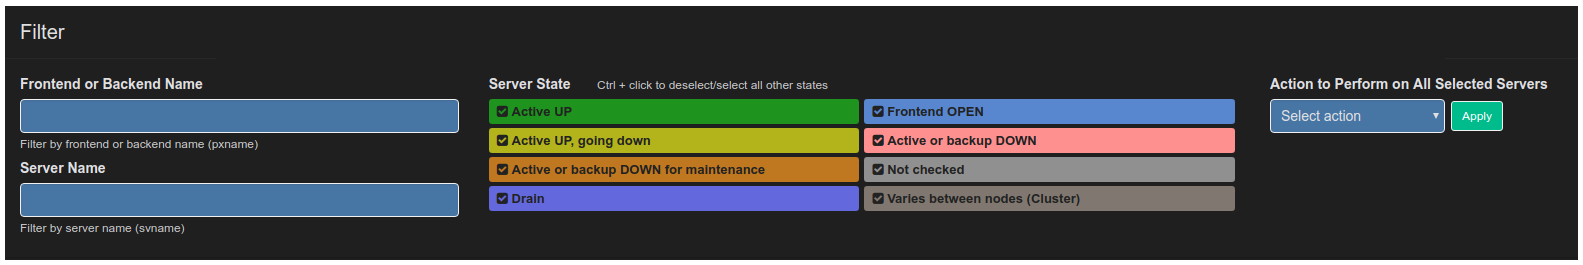
Select filter Jump to heading
You can set filters in the following ways:
-
Text - Allows filtering by Frontend or Backend Name (i.e. Proxy name) or by Server Name. There are three modes of filtering:
- Partial String Matching: For example, when you enter ss, it matches up with blessing, pass, or sserver.
- Multi-String Partial Matching: For example, when you enter we se it matches up with webserver, awesome_service and we_base.
- RegEx Matching: For example, when you enter a string that begins and ends with a forward slash (
/) it matches only those strings that a regular expression between those two slashes would match. The precise regular expression syntax used is JavaScript Regular Expressions.
-
Server Status - Allows filtering by server status. A click on any server status toggles its state between selected and unselected.
Use filter for administrative tasks:
For a list of administrative tasks, see the section on how to Manage servers.
Reset filter:
- Click Reset filter to restore the filter to default state (all Proxies/Servers visible); this function is enabled only when filter is active.
Hide filter:
- Click Hide filterto collapse the filter block (to free up vertical screen space).
Retrieve Stick Table contents Jump to heading
The Stick Table Explorer enables the user to retrieve the contents of stick tables from the HAProxy Enterprise node, and to sort them and filter them to gain insight into the data contained within, and even export them into Excel-friendly CSV format.
The Real-time Dashboard works with the Stick Table Explorer to enable you to explore the contents of HAProxy Enterprise Stick Tables in your node(s).
The aggregation cluster mode assumes that the Global Profiling Engine aggregates stick tables across the same set of nodes, and that the primary node uses aggregated stick tables from the Global Profiling Engine.
Local tables used for aggregation have the suffix .local, and resulting aggregated tables have the suffix .aggr (modifiable in General Settings).
Info
If you do not use the Global Profiling Engine in aggregation cluster mode, stick tables are only available in the single node mode from each of the HAProxy Enterprise nodes. In cluster mode, the non-aggregated tables get filtered out. The Stick Table Explorer pane is available, but the list of available stick tables is empty.
Apart from setting up the aggregation cluster and editing table suffixes as necessary, there is no additional setting to configure in Real-time Dashboard.
Retrieve a stick table Jump to heading
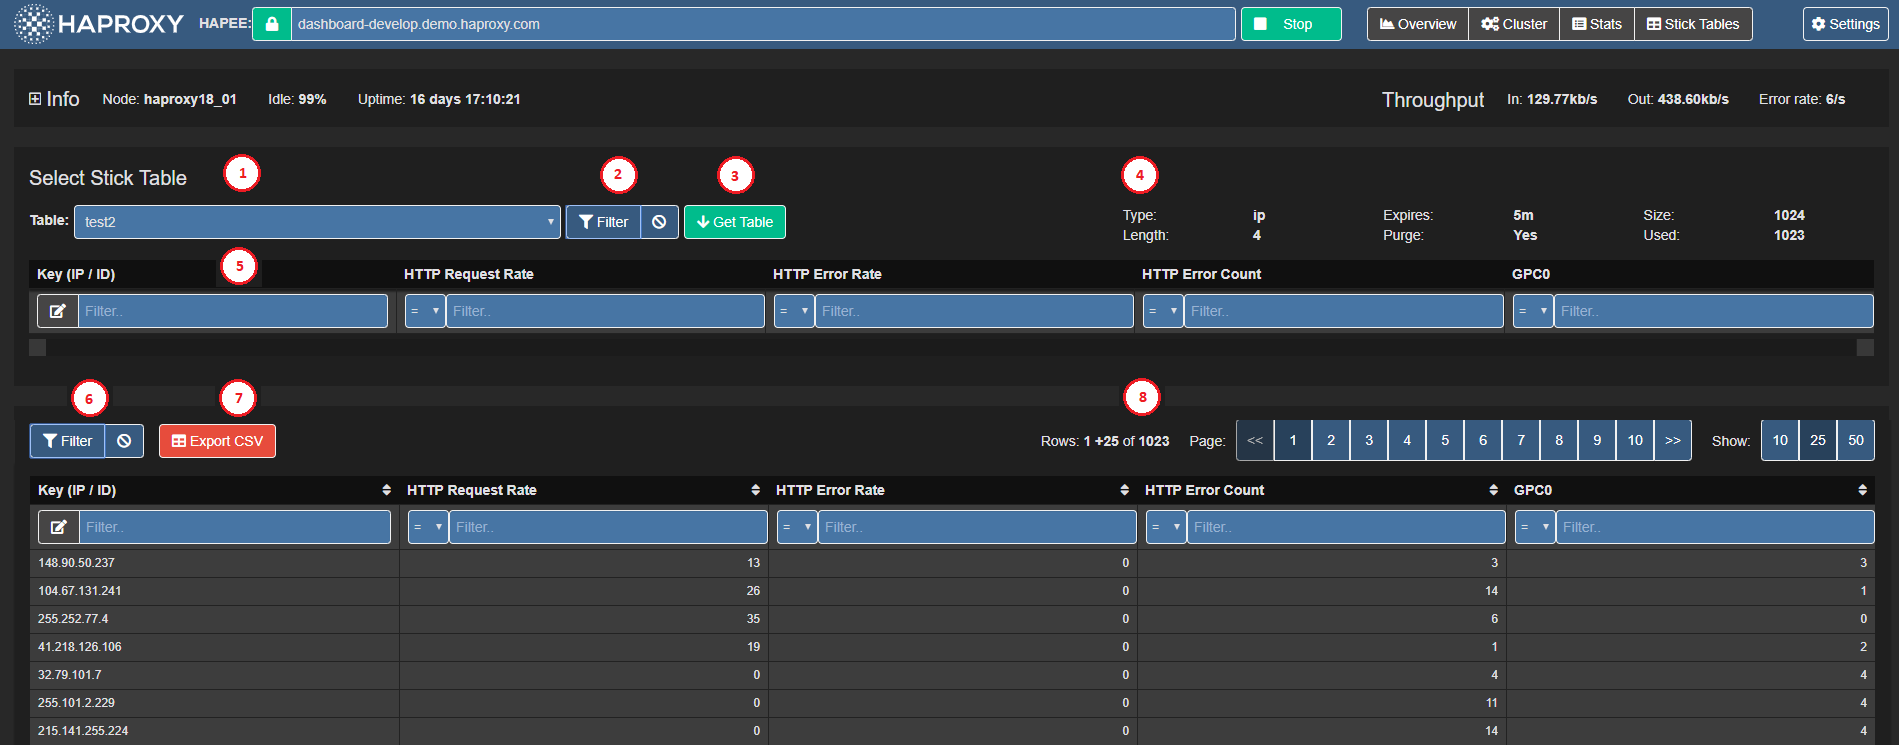
-
Click on Stick Tablesin the header bar to display the Stick Table Explorer.
-
Select a table from a drop-down list (1).
-
Filter out any unwanted data by clicking Filter (2) and specifying the filter criteria. Toggling this button shows or hides the filter.
-
Click Get (3) to retrieve the following stick table information (4):
- Type - type of key
- Length - number of table columns
- Expires - how long a row is kept in the table before it expires
- Purge - whether the table purges old elements
- Size - maximum number of rows
- Used - current number of rows
Apply filters Jump to heading
You can filter table data in two stages:
-
Globally, prior to node retrieval (5): Real-time Dashboard retrieves data on the HAProxy Enterprise node itself according to the filtering criteria (up to four maximum).
-
Locally, in the browser (6): In contrast to the global filter, which occurs on the HAProxy Enterprise node itself, the local filter happens within the browser. When you remove a criterion, the table refreshes accordingly; however, it has no effect on the amount of data retrieved from the node.
You can combine the two filters to limit the data retrieved and refine the data to display within the browser.
Set a filter using the interface:
-
Enter a key (string enclosed in quotes “”).
-
Select an operator from the drop-down list and enter a value.
Info
Key does not have any operator and requires a substring for matching.
Set a filter using an expression:
-
In the filter box, click on pencil icon to turn it into a text input box.
-
Enter an expression in the following format:
[data_name operator value] AND [data_name operator value] ... AND [data_name operator value]. The logical AND is implicit in the filter and no other logical operator is accepted.where:
- data_name is one of:
key, server_id, gpc0, gpc0_rate, gpc1, gpc1_rate, conn_cnt, conn_cur, conn_rate, sess_cnt, sess_rate, http_req_cnt, http_req_rate, http_err_cnt, http_err_rate, bytes_in_cnt, bytes_in_rate, bytes_out_cnt, bytes_out_rate. When you hover over the table header, a tool tip displays its data point name. - operator is any of =, !=, <, >, <= and =>
- value is numerical value used for comparison in the filter.
- data_name is one of:
Export CSV Jump to heading
-
Click CSV (7) to download the entire table in CSV format.
Info
All data gets exported to CSV, regardless of any filter previously set.
Navigate between pages Jump to heading
-
Click on the page number (8) or << and >> to switch pages.
-
Choose the number of items to display: 10, 25, or 50O.
Sort data Jump to heading
- Click on the up or down arrow next to the column header to sort data by ascending or descending order.
Understanding data from Real-time Dashboard Jump to heading
The Real-time Dashboard interface contains a number of input and output values. The following list documents their meaning, syntax, and, if applicable, the current method of value calculation.
Overview pane Jump to heading
The Overview pane displays general and summarized real-time information about the HAProxy Enterprise node.
| Overview | Description |
|---|---|
| Overview - Throughput | Real time throughput rates for the HAProxy Enterprise process, containing 3 values: In - Rate of incoming data, in bits per second. Out - Rate of outgoing data, in bits per second. Error Rate - HTTP Error Rate, in errors per second. |
| Overview - HTTP Request Rate | A graph representation of HTTP request rate, in requests per second. |
| Overview - HTTP Error Rate | A graph representation of HTTP error rate, in errors per second. |
| Overview - Average Response Time | A graph representation of average HTTP response time, in milliseconds. |
| Overview - HAProxy Enterprise Information | HAProxy Enterprise process information, containing: Instance name - HAProxy Enterprise info field Name. Instance version - HAProxy Enterprise info field Version. Node name - HAProxy Enterprise info field node. Process ID - HAProxy Enterprise info field Pid. Instance description - HAProxy Enterprise info field Description. Uptime - HAProxy Enterprise info field Uptime. Idle% - HAProxy Enterprise info field Idle_pct. |
| HTTP Requests | Description |
|---|---|
| HTTP Requests - Rate | Data block containing two values: Current HTTP request rate, in requests per second. Maximum allowed HTTP request rate, in requests per second. |
| HTTP Requests - Total | Data block containing two values: Total HTTP requests since the HAProxy Enterprise node was started or since the counters were reset. Highest HTTP request rate seen, in requests per second, since the HAProxy Enterprise node was started or since the counters were reset. |
| HTTP Requests - Error Rate | Data block containing two values: Current HTTP error rate, in errors per second. Highest HTTP error rate seen, in requests per second, since the HAProxy Enterprise node was started or since the counters were reset. |
| SSL Connections | Description |
|---|---|
| SSL Connections - Rate | Data block containing two values: Current SSL connection rate, in requests per second. Maximum allowed SSL connection rate, in requests per second. |
| SSL Connections - #Conn | Data block containing two values: Current number of active SSL connections. Maximum allowed number of active SSL connections. |
| SSL Connections - Total | Data block containing two values: Total SSL connections since the HAProxy Enterprise node was started or since the counters were reset. Highest SSL connection rate seen, in requests per second, since the HAProxy Enterprise node was started or since the counters were reset. |
| TCP Connections | Description |
|---|---|
| TCP Connections - Rate | Data block containing two values: Current TCP connection rate, in requests per second. Maximum allowed TCP connection rate, in requests per second. |
| TCP Connections - #Conn | Data block containing two values: Current number of active TCP connections. Maximum allowed number of active TCP connections. |
| TCP Connections - Total | Data block containing two values: Total TCP connections since the HAProxy Enterprise node was started or since the counters were reset. Highest TCP connection rate seen, in requests per second, since the HAProxy Enterprise node was started or since the counters were reset. |
| HAProxy Enterprise Real-time Dashboard Copyright and Version | Page footer containing the version of the HAProxy Enterprise Real-time Dashboard. The most recent released version is v1.0. |
Stats pane Jump to heading
The Stats pane displays detailed real time information about the HAProxy Enterprise frontends and backends, and allows you to perform management actions on servers.
| Filter | Description |
|---|---|
| Filter - Frontend/Backend Name | Filters the list and only displays frontend and backend sections whose name matches filter criteria. |
| Filter - Server Name Full or partial server name | Filters the list and only displays servers (and their corresponding frontend or backend sections) whose name matches the specified filter. |
| Filter - Server State List of server states | Filters the list and only displays servers (and their corresponding frontend or backend sections) whose state matches one of the selected states. Holding Ctrl while clicking on a particular state will deselect or select all other states for convenience. |
| Filter - Action to perform | Select the action to perform on all servers visible after filtering (see Manage servers) |
The checkbox left of the frontend/backend/listen name selects all servers in the block for the Server Management ------ Actions at the bottom. For each server line:
| Field | Description |
|---|---|
| Server name | Name of the server (svname) |
| Queue - Cur | Current number of requests in server’s queue |
| Queue - Max | Maximum value of current queued requests |
| Queue - Limit | Configured maximum queue for the server |
| Session Rate - Cur | Number of sessions per second over last elapsed second |
| Session Rate - Max | Maximum number of new sessions per second |
| Session Rate - Limit | Configured limit on new sessions per second |
| Sessions - Cur | Current number of sessions |
| Sessions - Max | Maximum number of sessions |
| Sessions - Limit | Configured session limit |
| Sessions - Total | Cumulative number of sessions |
| Sessions - LbTot | Total number of times the server was selected |
| Bytes - In | Cumulative bytes in to server |
| Bytes - Out | Cumulative bytes out from server |
| Denied - Req | Requests denied due to security concerns |
| Denied - Resp | Responses denied due to security concerns |
| Error - Req | Request errors |
| Error - Conn | Number of requests that encountered an error while trying to connect to a backend server |
| Error - Resp | Response errors |
| Warnings - Retr | Number of times a connection to a server was retried |
| Warnings - Redis | Number of times a request was redispatched to another server |
| Server - Status | Current status and time elapsed since last UP <-> DOWN transition |
| Server - LastChk | Status of last health check |
| Server - Wght | Total weight (backend), or server weight (server) |
| Server - Act | Number of active servers (backend) |
| Server - Bck | Number of backup servers (backend) |
| Server - Chk | Failed Health Checks |
| Server - Dwn | Number of UP -> DOWN transitions |
| Server - Dwntime | Total downtime (backend) |
| Server - Throttle | Current throttle percentage for the server |
| Actions | Action on server: Enable - Set server to READY. Disable - Set server to MAINT. |
Manage servers Jump to heading
You can perform specific management tasks on selected frontends, backends and listen blocks.
Perform an action on server(s) Jump to heading
-
Select a server by clicking on the checkbox next to its name. To select all servers in a block, click the checkbox next to the block name.
-
Select a task from the drop-down list (see below).
-
Click Apply.
Statistics Description Set state to READY Set server state to READY (Enable Server) Set state to DRAIN Set server state to DRAIN (remove from load-balancing, but remain available for health checks and persistent connections) Set state to MAINT Set server state to MAINT (Disable Server) Health: disable checks Mark primary server health checks as temporarily stopped Health: enable checks Enable primary server health checks Health: force UP Force server health to UP (regardless of pending checks) Health: force NOLB Force server health to NOLB state (regardless of slow checks) Health: force DOWN Force server health to DOWN (regardless of pending checks) Agent: disable checks Mark auxiliary agent checks as temporarily stopped Agent: enable checks Enable auxiliary agent checks Agent: force UP Force server agent state to UP Agent: force DOWN Force server agent state to DOWN Kill Sessions Immediately terminate all server sessions
Do you have any suggestions on how we can improve the content of this page?