Integrations
Elastic Stack
This page applies to:
- HAProxy Enterprise - all versions
This section illustrates how to connect the load balancer to Elastic Stack, a suite of applications for visualizing metrics along with Metricbeat and its HAProxy module, which is installed on each load balancer server to ship metrics and logs from the load balancer to the Elastic Stack.
Installation Jump to heading
Elastic Stack is a highly scalable and highly configurable suite of applications that can be deployed on a single machine or dozens of machines, depending upon the volume of data that must be processed, the rate at which the data is ingested, as well as the complexity of the output visualizations desired.
-
Follow the Installing Elasticsearch guide to install Elasticsearch onto a server.
We will store metrics data in Elasticsearch.
-
Follow the Installing Kibana guide to install Kibana onto another server.
We will visualize our data with Kibana.
-
By default, Elasticsearch is available on port 9200. You can test this using
curl:nixcurl -X GET "<elasticsearch_server_ip>:9200"nixcurl -X GET "<elasticsearch_server_ip>:9200"outputtext{"name" : "es01","cluster_name" : "es-docker-cluster","cluster_uuid" : "2PSZIzo_SH-AEDK9nkPELw","version" : {"number" : "7.12.0","build_flavor" : "default","build_type" : "docker","build_hash" : "78722783c38caa25a70982b5b042074cde5d3b3a","build_date" : "2021-03-18T06:17:15.410153305Z","build_snapshot" : false,"lucene_version" : "8.8.0","minimum_wire_compatibility_version" : "6.8.0","minimum_index_compatibility_version" : "6.0.0-beta1"},"tagline" : "You Know, for Search"}outputtext{"name" : "es01","cluster_name" : "es-docker-cluster","cluster_uuid" : "2PSZIzo_SH-AEDK9nkPELw","version" : {"number" : "7.12.0","build_flavor" : "default","build_type" : "docker","build_hash" : "78722783c38caa25a70982b5b042074cde5d3b3a","build_date" : "2021-03-18T06:17:15.410153305Z","build_snapshot" : false,"lucene_version" : "8.8.0","minimum_wire_compatibility_version" : "6.8.0","minimum_index_compatibility_version" : "6.0.0-beta1"},"tagline" : "You Know, for Search"} -
Ensure that your load balancer configuration has the Runtime API enabled:
haproxyglobalstats socket ipv4@*:9999 user haproxy group haproxy mode 660 level adminhaproxyglobalstats socket ipv4@*:9999 user haproxy group haproxy mode 660 level admin -
Follow the Installing Metricbeat guide to install Metricbeat onto your load balancer server.
-
Enable the Metricbeat HAProxy module:
nixsudo metricbeat modules enable haproxynixsudo metricbeat modules enable haproxy -
Edit the file
/etc/metricbeat/metricbeat.ymlso that it lists your Elasticsearch server under the output.elasticsearch section:yamloutput.elasticsearch:hosts: ["<elasticsearch_server_ip>:9200"]yamloutput.elasticsearch:hosts: ["<elasticsearch_server_ip>:9200"] -
Edit the file
/etc/metricbeat/modules.d/haproxy.ymlto configure the HAProxy module so that the hosts field includes the address and port where your HAProxy Runtime API is listening:yaml- module: haproxymetricsets: ["info", "stat"]period: 10shosts: ["tcp://<haproxy_server_ip>:9999"]enabled: trueyaml- module: haproxymetricsets: ["info", "stat"]period: 10shosts: ["tcp://<haproxy_server_ip>:9999"]enabled: true -
Restart the Metricbeat service to begin shipping HAProxy metrics to Elasticsearch:
nixsudo service metricbeat restartnixsudo service metricbeat restart -
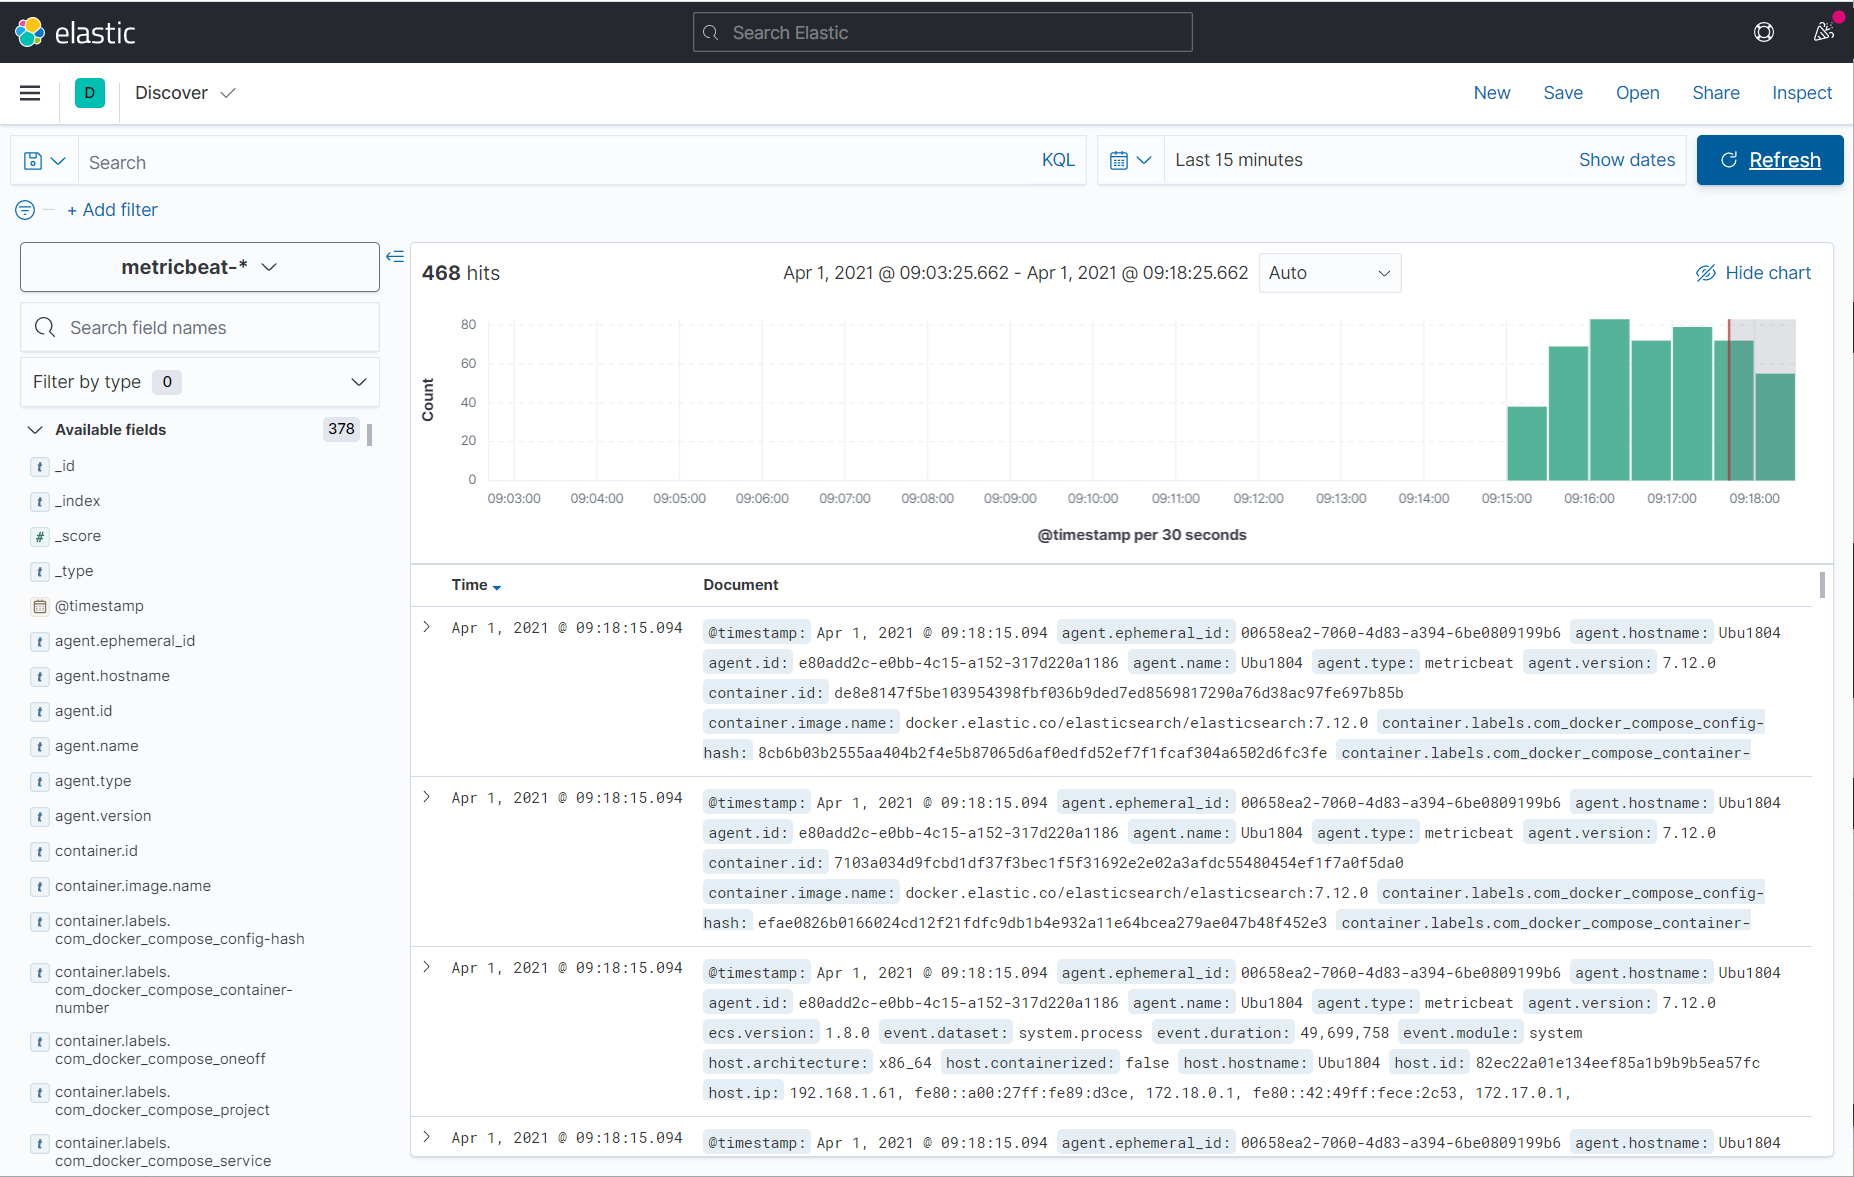
Open Kibana’s interface,
http://<kibana_server_ip>:5601/app/discover#/using a web browser.If everything is working correctly, you will see that your metrics are being collected:
-
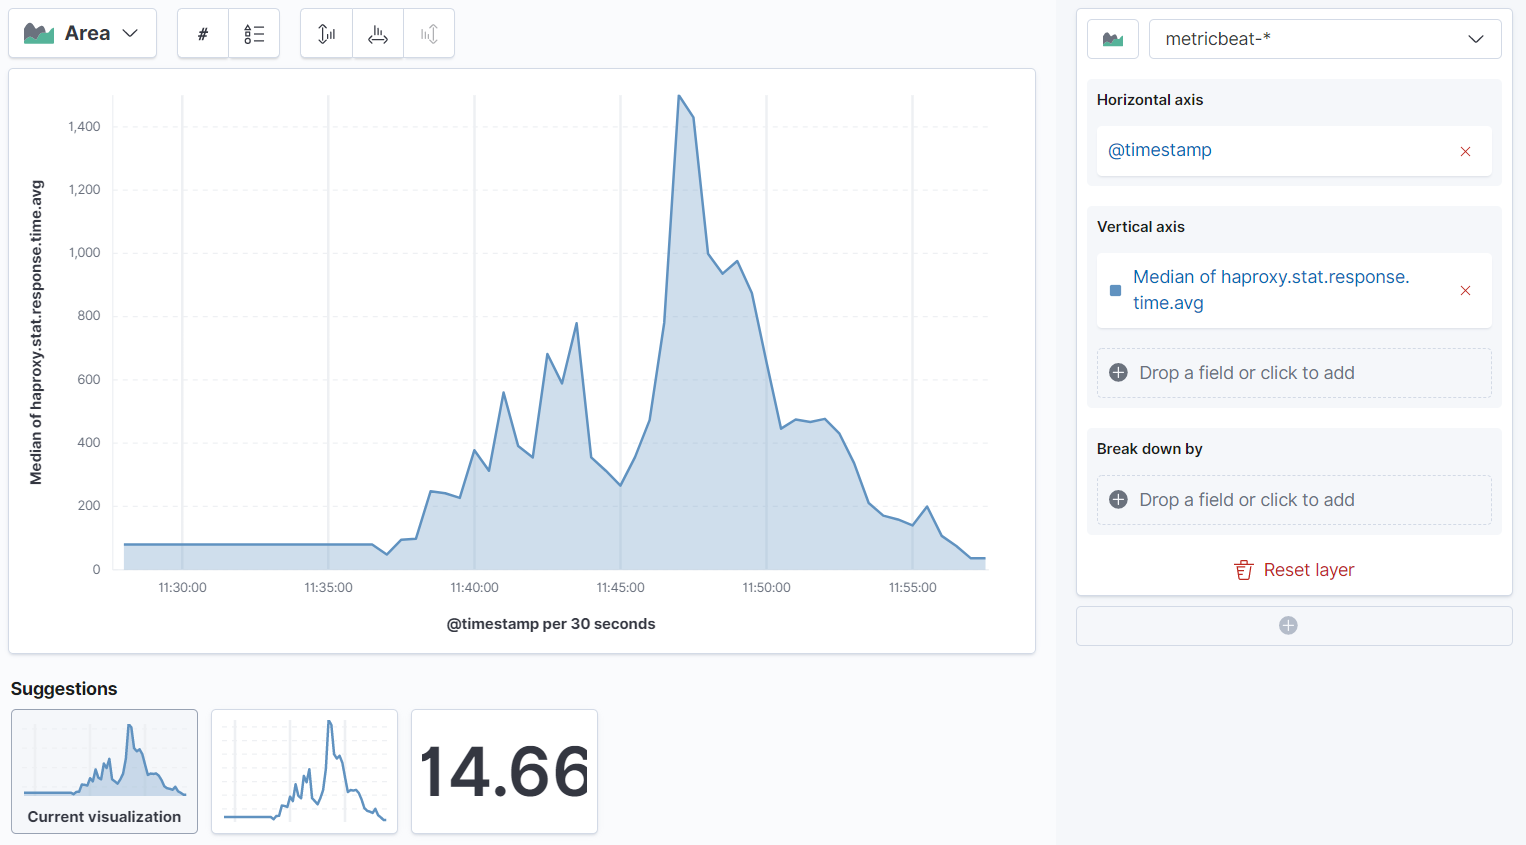
Begin creating visualizations using Kibana’s Lens application,
http://<kibana_server_ip>:5601/app/lens/.Drag and drop fields to the visualization area and adjust your timeframe.
In this example, we added a metric for response time during a benchmarking test:
Do you have any suggestions on how we can improve the content of this page?