OpenTelemetry
Export traces using the HAProxy OpenTelemetry filter
This page applies to:
- HAProxy 3.4 and newer
- HAProxy Enterprise 3.2r1 and newer
The HAProxy OpenTelemetry filter enables you to see what’s happening inside the load balancer as it processes a live request. This view is called a trace.
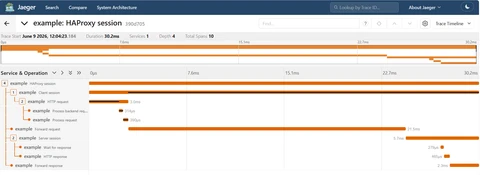
A trace is composed of time spans. For example, between a client starting a session and later sending a full HTTP request, we can measure a span of time. With numerous events that have start and end times, we record the time spans between each and link them to form a complete picture of the actions within the load balancer, the order in which they occurred, and how long each action took.
Some spans are nested within, or children of, other time spans. HAProxy processes an HTTP request-response session in two phases: receive, process, and relay the request; and receive, process, and relay the response. Both are parts of the client’s overall HAProxy session. So, we could configure spans for the request and response phases as children of the HAProxy session span.
In other cases, one action causes another, but the two don’t have a parent-child relationship. For instance, if you develop a Lua script that sends an asynchronous HTTP request to an IP reputation service, you could define a span link that indicates that the HAProxy session causes that Lua action, but that it happens concurrently.
In the upcoming sections, you’ll learn how to define spans and their relationships.
Data delivery not guaranteed
One important assumption when working with OpenTelemetry data is that there is no guarantee that all telemetry will be successfully exported to the destination. The OpenTelemetry specification doesn’t mandate guaranteed delivery; therefore, data loss can occur at various stages of collection, processing, or export and should be considered a normal operational possibility. If you have very high traffic, a large number of active connections, and you send a lot of data to the OpenTelemetry system, some of it may be lost.
Enable OpenTelemetry traces Jump to heading
In this section, we cover how to configure HAProxy for OpenTelemetry traces.
Configure the OpenTelemetry filter Jump to heading
The filter opentelemetry directive enables instrumentation of HAProxy, which means emitting signals such as traces, logs, and metrics. It has two arguments:
idsets a unique identifier for this filter.configindicates the path to the instrumentation file.
hapee-lb.cfghaproxy
hapee-lb.cfghaproxy
haproxy.cfghaproxy
haproxy.cfghaproxy
Next, let’s examine the instrumentation file.
Create an instrumentation file Jump to heading
HAProxy exposes events as they happen within the load balancer so that you can add them to a trace. You must define which events to watch by creating an OpenTelemetry instrumentation file. Add a file with a .cfg file extension at the location specified in the HAProxy configuration from the previous section. In our example, we name it instrumentation.cfg.
instrumentation.cfgini
instrumentation.cfgini
-
At the start of the file, add your filter’s ID in square brackets. It should match the
filter opentelemetrydirective’sidargument. -
Below that, add an
otel-instrumentationdirective to mark the beginning of your settings. Its only argument is a name. -
Nested under
otel-instrumentation, set the required directiveconfigto the location of your OpenTelemetry C++ client library configuration. This is a YAML file that passes your telemetry data through a pipeline of providers, processors, samplers, and exporters. As an example, you can export your data to a running instance of OpenTelemetry Collector or to Jaeger. To learn about that file, see Configure the client library.See the HAProxy OpenTelemetry filter configuration guide for other directives that you can place in an
otel-instrumentationsection.
Instrumentation file formatting
A few items to note about formatting:
- Indentation is optional, but it helps make your file easier to read.
- End the file with a blank newline, or else you’ll get an error.
- You can add comments to the file (documentation text) by prefixing the text with a hash (
#). - Set the
debug-leveldirective to0x77fto set the debug bitmask. This is effective only when compiled withOTEL_DEBUG=1.
Define scopes Jump to heading
A scope is a configuration section in your instrumentation file that defines a span and associates it with an HAProxy event. To define a span, you must add it inside a scope. A scope can also include a span’s metadata, such as attributes, span events, span links, baggage, ACLs, span status, and injected context.
Let’s start with a set of predefined scopes that you can customize.
instrumentation.cfgini
instrumentation.cfgini
- Below the
otel-instrumentationsection, addotel-scopesections. These define one or more spans and associate them with HAProxy events. The firing of the event triggers the start of the span. - One span must be labeled
root, designating it the top-level span to which other spans are children. - Some
otel-scopesections definefinishdirectives, which indicate spans to stop. You can also setfinishto an asterisk (*) to stop all spans. To stop all request-channel spans, use*req*. To stop all response-channel spans, use*res*. Spans continue until afinishdirective stops them. - In the
otel-instrumentationsection, setscopesdirectives to addotel-scopesections to the trace.
There are many events that you can include in your trace. The table below covers them.
| otel-event | Description |
|---|---|
on-stream-start |
This event fires before any channel processing begins. No channel is available at that point, so context injection/extraction via HTTP headers cannot be used in scopes bound to these events. When tracing HTTP services, if you want to extract context from an HTTP header, then it’s better to use on-frontend-http-request as the event attached to the root span instead of this event. Sample fetches in these scopes aren’t direction-constrained. |
on-client-session-start |
This event fires when the analysis of the request channel (data pipe between the client and HAProxy) begins. It corresponds to the start of a new client session. |
on-frontend-tcp-request |
This event fires during TCP request content inspection on the frontend. During this stage, any tcp-request content actions that are defined on the frontend run, which can determine whether to accept or reject the TCP request. |
on-http-wait-request |
This event fires after the load balancer has waited for the complete HTTP request and has now received it. This wait period could stop analysis if it exceeds timeout http-request or timeout client. |
on-http-body-request |
This event fires after the load balancer has waited for the HTTP request body, which is now available for inspection. This stage can continue if the buffer is full or the advertised contents have reached the buffer. |
on-frontend-http-request |
This event fires during the processing of the HTTP request rules defined on the frontend. At this stage, the load balancer processes ACLs, filters, statistics, redirects, and HTTP header rules including the Connection header. There can be http-request deny rules that stop processing. |
on-switching-rules-request |
This event fires when the load balancer implements default_backend and use_backend rules to choose the backend. |
on-backend-set |
This event fires when a backend is assigned to the stream. It isn’t called if the proxy is a listen section. |
on-backend-tcp-request |
This event fires during TCP request content inspection on the backend. During this stage, any tcp-request content actions that are defined on the backend run, which can determine whether to accept or reject the TCP request. |
on-backend-http-request |
This event fires during the processing of the HTTP request rules defined on the backend. At this stage, the load balancer processes ACLs, filters, statistics, redirects, and HTTP header rules including the Connection header. There can be http-request deny rules that stop processing. |
on-process-server-rules-request |
This event fires when the load balancer evaluates use-server directives in a backend. |
on-http-process-request |
This event fires when the load balancer performs all the processing enabled for the request. At this point, unwanted requests have been filtered out. |
on-tcp-rdp-cookie-request |
This event fires when the load balancer applies Windows Remote Desktop Protocol (RDP) server persistence rules to the current stream, which happens when persist rdp-cookie is set. |
on-process-sticking-rules-request |
This event fires when the load balancer applies stick table server persistence rules, such as for stick on and stick store-request directives. |
on-http-headers-request |
This event fires after all HTTP request headers have been parsed and analyzed. |
on-http-end-request |
This event fires when all HTTP request data has been processed and forwarded to the backend server. |
on-client-session-end |
This event fires when the request channel analysis ends. |
on-server-unavailable |
This event fires during request channel end-analysis when response analyzers were configured but never executed because the server wasn’t reached. |
on-server-session-start |
This event fires when the analysis of the response channel (data pipe between HAProxy and the backend server) begins, after a server connection has been established. |
on-tcp-response |
This event fires during TCP response content analysis on the current response. During this stage, any tcp-response content actions that are defined on the backend run, which can determine whether to accept or reject the TCP response. |
on-http-wait-response |
This event fires after the load balancer has waited for the complete HTTP response and has now received it. This wait period could stop analysis if it exceeds timeout server. |
on-process-store-rules-response |
This event fires when the load balancer evaluates stick store-response directives. |
on-http-response |
This event fires when the load balancer performs all the processing enabled for the response. |
on-http-headers-response |
This event fires after all HTTP response headers have been parsed and analyzed. |
on-http-end-response |
This event fires when all HTTP response data has been processed and forwarded. |
on-server-session-end |
This event fires when the response channel analysis ends. |
on-stream-stop |
This event fires after all channel processing ends. It typically finishes all active spans. No channel is available at that point, so context injection/extraction via HTTP headers cannot be used in scopes bound to these events. Sample fetches in these scopes aren’t direction-constrained. |
on-idle-timeout |
This event fires periodically when the stream has no data transfer activity. It requires the idle-timeout directive to set the interval. This event is useful for heartbeat spans, idle-time metrics, and idle-time log records. |
Configure the client library Jump to heading
To send your telemetry data to software that can process it, such as OpenTelemetry Collector or Jaeger, you must add a client library configuration YAML file. This file controls the underlying OpenTelemetry C++ client and configures export settings for traces, metrics, and logs. You can set more than just where to export data though, by configuring these sections:
exportersdefine where to send telemetry data. Supported YAML exporters areotlp_grpc,otlp_http,otlp_file,zipkin,elasticsearch,ostream, andmemory.samplerscontrol trace the sampling strategy (traces only).processorsdefine how telemetry is batched before export (traces and logs only).readersconfigure periodic metric collection intervals (metrics only).providersset resource attributes attached to all telemetry.signalsbind the above components together per signal type.
See the HAProxy OpenTelemetry C Wrapper documentation for full details.
In the example below, we export the data by using the OpenTelemetry Protocol (OTLP) exporter type. It targets localhost:4318. You can run OpenTelemetry Collector at that address, or other software, such as Jaeger.
otel-client.yamlyaml
otel-client.yamlyaml
Restart the OpenTelemetry filter Jump to heading
To apply changes to the OpenTelemetry filter or its associated configuration files, reload HAProxy. For example:
nix
nix
nix
nix
Customize your trace Jump to heading
You can customize tracing, as explained in the following sections.
Add other spans Jump to heading
You can add other spans to your trace. For example:
instrumentation.cfgini
instrumentation.cfgini
To add a span:
-
Add an
otel-scopesection to your instrumentation file. On the line where you declare theotel-scope, set a name. -
Inside that
otel-scopesection, set aspandirective. The name you give the span will appear in the trace. For example, useBackend switching rules; set itsparentargument to indicate which span this span is a child of.Choosing the parent span
How do you know which span is the parent? The choice is yours. You can make a deeply nested trace or create a shallow hierarchy. It helps to remember that a span starts when an event fires and it continues until you stop it with a
finishdirective. That means you can keep a span going to serve the purpose of being a parent.From our original example, we started three spans from the same event, and they can all be parents to other spans: The
HAProxy sessioncan be the top-most parent; theClient sessionspan can be the parent to any spans that relate to work on the frontend; theHTTP requestspan can be the parent to other spans that relate to processing the HTTP request.instrumentation.cfginiotel-scope frontend_http_requestspan "HAProxy session" rootspan "Client session" parent "HAProxy session"span "HTTP request" parent "Client session"otel-event on-frontend-http-requestinstrumentation.cfginiotel-scope frontend_http_requestspan "HAProxy session" rootspan "Client session" parent "HAProxy session"span "HTTP request" parent "Client session"otel-event on-frontend-http-requestWithout a
parentargument, your span will become a root span and start an entirely new trace. -
Inside the
otel-scopesection, set anotel-eventdirective to indicate the HAProxy event that will trigger the start of the span. See the list of available otel-events. -
Optional: Add a
finishdirective if the start of this span should be the end of another span. You’ll likely need to finish the span you’re creating in another span. -
In the
otel-instrumentationsection, add ascopesdirective with its argument being the name you gave to theotel-scope. This adds the scope to the trace.
Set attributes on spans Jump to heading
You can set attributes on a span to capture extra, relevant information. Use the attribute directive in an otel-scope section to set a key and its value. There’s a convention to use dots in the name as a way to organize related attributes into categories, but the name is up to you. When declaring attributes, indentation is optional, but improves readability. An attribute applies to the active span, meaning the span declared prior to the attribute directive.
The syntax for an attribute is:
text
text
The value is a fetch. See the configuration tutorial on fetches.
Here’s an example:
instrumentation.cfgini
instrumentation.cfgini
Trigger spans with an otel-group action Jump to heading
You can group one or more scopes and then trigger them from your HAProxy configuration file via an otel-group action. These directives support this action:
http-request otel-group <filter-id> <group> [condition]http-response otel-group <filter-id> <group> [condition]http-after-response otel-group <filter-id> <group> [condition]tcp-request content otel-group <filter-id> <group> [condition]tcp-response content otel-group <filter-id> <group> [condition]
Suppose you want to pause processing of a request for three seconds and have that represented as a span in the trace. Add the following lines to your HAProxy configuration:
- Add an
http-request otel-groupaction that triggers a group of scopes namedstart_pause_group. - Start a pause via
http-request pause 3s. - Use an
http-request otel-groupaction to trigger the group of scopes namedend_pause_group.
haproxy
haproxy
In your instrumentation file, add these lines:
- A
groupsdirective that adds groups to the trace. - Two
otel-groupsections that define the groups. Inside each group, we set the scopes. - Two
otel-scopesections that define the scopes. Note that when triggered exclusively by anotel-groupaction in your HAProxy configuration, you don’t need to set anotel-eventin theotel-scope.
instrumentation.cfgini
instrumentation.cfgini
Your trace will show a new span named Paused pipeline that lasts for three seconds.
Set timestamped events on spans Jump to heading
A span represents a unit of work that has a start and an end time, but you can also define span events, which are events that happen during a single point in time. The event directive, which goes into an otel-scope, has this syntax:
text
text
It expects a name for the event and a key-value, which sets an event attribute.
For example, suppose you wanted to capture the point in time when an HTTP redirect happens. Add these lines to your HAProxy configuration to perform the redirect:
- An
http-request set-vardirective that sets a variable namedreq.targetpathto the URL path,/newurl, to which we’ll redirect the user. Using a variable simplifies the configuration, allowing us to reuse the value in multiple spots, including a line that checks if the user has already been redirected to this URL, preventing a loop. - An ACL named
redirectedthat checks if the current path is the redirect URL. This lets us know if we’ve already performed the redirect. - An
http-request redirectdirective that performs the HTTP redirect, unless the redirect has already been performed. For more information, see the HTTP redirects configuration tutorial.
haproxy
haproxy
In the instrumentation file, the otel-scope named finish_http_request comes from a previous example. This contains the span that we’ll add an event to.
- The
aclline defines theredirectedACL in the instrumentation file. It returns true if the currently requested URL path matches the target redirect path, indicating if we’ve already performed the redirect. - The
eventdirective adds a timestamped event namedredirectedwith an attribute namedredirect.targetpath, which contains the target redirect path. We add the event only if the ACL is true.
instrumentation.cfgini
instrumentation.cfgini
Your span will now show an event named redirected attached to the span named Forward request. The event will capture the redirect URL path.
Set the span status Jump to heading
A span has a status that indicates whether it succeeded or if an error occurred. By default, this status remains unset unless you set it. The status directive, which goes into an otel-scope section, has this syntax:
text
text
It can have one of these codes:
| Status | Description |
|---|---|
error |
The operation contains an error. When using error, you can set one or more sample fetches to add an error message. For example: status "error" str("http.status_code: ") status. |
ignore |
Don’t set a status. (Default) |
ok |
The operation completed successfully. |
unset |
Explicitly mark the status as unset. |
Suppose you wanted to check whether the backend server returned a successful HTTP response or an error. If the response contains an error, you can set a description on the status line, such as to capture the HTTP status code. If the response was successful, you’ll set the span’s status to ok and also set attributes that capture the message’s content-type and content-length.
In your instrumentation file, the following lines set the status:
- An
acldirective checks whether the HTTP status is between 100 and 399, which indicates a success. - The
otel-scopenamedhttp_responsecomes from our previous example. It contains the span namedHTTP response, for which we want to set a status. - A
statusdirective sets the status of the span. We use anifstatement that checks the ACL namedacl-http-status-okto know whether to set anokorerrorstatus. - When the
acl-http-status-okACL is true, we also set attributes for the content-type and content-length.
instrumentation.cfgini
instrumentation.cfgini
Your span will now show a status of either OK or ERROR, depending on the HTTP response received from the server. If it’s ok, we set attributes that capture the content-type and content-length. If it’s an error, we set an error status description like http.status_code: 500.
Set span links Jump to heading
In some cases, a span has a cause-effect relationship with another span instead of a parent-child relationship, such as when the processing of an HTTP request triggers the start of an asynchronous task. In those cases, you can define a span link. Span links appear in your trace as hyperlinks to the related span, making it easy to jump from one span to the other in the trace.
For example, suppose you wanted to use the HAProxy Enterprise Traffic Mirroring module to send a copy of the HTTP request to a QA server to process it through a new version of HAProxy, prior to deploying that version to your production servers. This traffic mirroring happens asynchronously. Linking this unit of work to your HAProxy session span offers a way to represent this relationship.
Add these lines to your HAProxy configuration:
- An
http-request otel-groupaction that triggers the OpenTelemetry group namedmirror_traffic.
haproxy
haproxy
In your instrumentation file, add these lines:
- In the
otel-instrumentationsection, add agroupsdirective that adds the group namedmirror_trafficto the trace. - The
otel-groupsection namedmirror_trafficcontains the scope namedmirror_traffic. - The
otel-scopesection namedmirror_trafficdefines a new span,Mirror traffic, that’s a child of theHAProxy sessionspan. Thelinkdirective links this span to the span namedHTTP request. We also add attributes to the link, which allow you to set metadata.
instrumentation.cfgini
instrumentation.cfgini
Your trace will show a span named Mirror traffic that has a link to the HTTP request span.
Propagate context across services Jump to heading
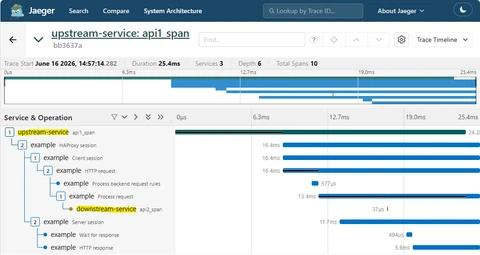
The power of OpenTelemetry lies in its support for distributed tracing, which is the ability to track a request as it moves between services, crossing process and system boundaries, perhaps traversing a series of microservices or application servers in a network. By collecting telemetry data from each point along the way and correlating it via a shared context (the trace ID and parent span ID), you can see the full picture. Your trace can reveal the system’s overall health and pinpoint bottlenecks.
To add the spans that HAProxy produces to a larger trace, you can extract the shared context from an HTTP header that was set by an upstream service. To pass the context to a service downstream, you can inject the context into an HTTP header.
To extract context from an HTTP header, change the otel-scope section that defines your root span:
- Add an
extractdirective with ause-headersargument to get the context from thetraceparentHTTP header and store it in a variable. We prefix the variable name with a dash,-mycontext. When the first character is a dash, the context name will be excluded from the HTTP header, making it compatible with non-HAProxy services. If the upstream service is HAProxy, you can omit the dash, allowing you to prefix the header value with a name. - If you’re propagating context between two OpenTelemetry filters in the same HAProxy configuration (not inter-process), you can pass the context via variables, which is faster than HTTP headers. Use the
use-varsargument instead ofuse-headers. - Instead of setting the
rootargument on the top-most span, setparentto the name of the variable.
instrumentation.cfgini
instrumentation.cfgini
Test it with Python
This Python script, based on the OpenTelemetry Python propagation example, starts a web server on port 5002. It passes the context in an HTTP header to http://127.0.0.1:80/, where it expects HAProxy to be listening. It sends its spans via the OTLP exporter to http://localhost:4318/v1/traces. With this running, if you access the application at port 5002, it will combine its spans with the HAProxy spans, which are sent to the collector at port 4318.
upstream.pypy
upstream.pypy
To run this on Debian, try these commands:
sh
sh
To inject the context into an HTTP header, add the inject directive to an otel-scope that uses one of the following HAProxy events:
- on-client-session-start
- on-frontend-tcp-request
- on-http-wait-request
- on-http-body-request
- on-frontend-http-request
- on-switching-rules-request
- on-backend-tcp-request
- on-backend-http-request
- on-http-tarpit-request
- on-process-server-rules-request
- on-http-process-request
- on-tcp-rdp-cookie-request
- on-process-sticking-rules-request
- on-http-headers-request
- on-http-wait-response
- on-process-store-rules-response
- on-http-response
- on-http-headers-response
Example
instrumentation.cfgini
instrumentation.cfgini
The active span becomes the parent to the downstream service’s spans. In this case, we use the Process requests span.
Test it with Python
This Python script, based on the OpenTelemetry Python propagation example, starts a web server at localhost on port 5001. It receives the context in an HTTP header. It sends its spans via the OTLP exporter to http://localhost:4318/v1/traces. With this running, if you set 127.0.0.1:5001 as a backend server in your HAProxy configuration, it will combine its spans with the HAProxy spans, which are sent to the collector at port 4318.
downstream.pypy
downstream.pypy
To run this on Debian, try these commands:
sh
sh
Use baggage to pass data across services Jump to heading
Baggage is data that you can pass between services when propagating context. For example, you can use it to pass the name of the upstream service to HAProxy. Another example: You can use it to pass the name of the HAProxy backend to a downstream service. Baggage makes it easy to share information that can help during debugging.
When HAProxy gets baggage from an extracted context, it becomes automatically available to child spans and downstream services. You can also add new key-value pairs to baggage. Beware that because baggage that you add will be transferred to downstream services, and is in a sense global data, you should check that you’re not sharing sensitive information like passwords and keys.
- When your
extractdirective usesuse-headers, HAProxy gets baggage from thebaggageHTTP header. - When your
extractdirective usesuse-vars, HAProxy gets baggage from variables stored in the context.
To add a key-value pair to baggage, use the baggage directive.
instrumentation.cfgini
instrumentation.cfgini
Set variables Jump to heading
To keep your instrumentation file tidy, it can help to store fields in variables. Variables propagate to child spans, so you could declare variables in a parent span and use them in child spans.
- Use
set-varfor storing sample fetch values. Its arguments are the variable’s name, then the fetch. This directive supportsifandunlesscondition statements. - Use
set-var-ctxfor storing a field from a referenced span or span context. Its arguments are the variable name, a reference to a span or context, and the field to store. This directive supportsifandunlesscondition statements. - Use the
varfetch to read a variable by its name. - Use
unset-varto remove a variable.
instrumentation.cfgini
instrumentation.cfgini
The set-var-ctx directive supports storings these fields:
| Field | Description |
|---|---|
| trace-id | trace id, lowercase hex |
| span-id | span id, lowercase hex |
| trace-flags | W3C trace-flags byte, lowercase hex |
| traceparent | full W3C 00-<trace>-<span>-<flags> string |
| tracestate | full tracestate header (context references only) |
| tracestate( |
a single tracestate entry (context references only) |
| baggage | the whole baggage carrier (all entries) |
| baggage( |
a single baggage entry value |
| sampled | 1 if the sampled flag is set, else 0 |
| valid | 1 if the context is valid, else 0 |
| remote | 1 if the context is remote, else 0 |
Rate limit filter activations Jump to heading
Traces help you understand how requests flow through your application. They help identify bottlenecks or other problem areas. But you don’t always need to capture every request to get these insights. To record telemetry data for only a percentage of your traffic, set a rate limit to activate the filter for that percentage.
In your instrumentation file, under the otel-instrumentation section, set the rate-limit directive to a floating-point number between 0.0 and 100.0. It defaults to 100.0. This directive sets the percentage of streams for which the filter will be active. In the example below, the filter is active for 50% of streams.
instrumentation.cfgini
instrumentation.cfgini
Define ACLs Jump to heading
You can define named, reusable ACL expressions in the instrumentation file to use with if and unless conditions. For a full description of ACLs, see the ACLs configuration tutorial.
In the otel-instrumentation section or any of the otel-scope sections, use the acl directive. It compares a sample fetch value against a known value. If there’s a match, the expressions return true, otherwise false.
In this example, we define an ACL named acl-http-status-ok and then use it when deciding how to set the status of the HTTP response span. We could have instead set this ACL in the otel-scope section.
instrumentation.cfgini
instrumentation.cfgini
See also Jump to heading
- The HAProxy OpenTelemetry GitHub documentation describes the tracing directives and arguments.
- The HAProxy OpenTelemetry C Wrapper documentation describes the configuration syntax for the client library.